The present-day information behind the 'Human dynamics of climate change' poster
Find out more about the present-day information behind the 'Human dynamics of climate change' poster
The present-day data comes from the period 2000-2013 as a time slice representative of the start of the 21st century.
A short description of the different data types is shown below, along with links to sources. In addition to data on human activity, current tropical cyclone regions and major glaciers are also included. You can access further detail, and a comprehensive summary of the data, in the technical report in the panel to the right of this page. Here, you will also find a PDF of the poster and supplementary information.
Population density
The present-day population density is displayed in order to show where people live in the world. This is the 2010 estimated population density as used in the 'middle of the road' socio-economic scenario (SSP2).
Global trade dynamics
In order to highlight countries that are important suppliers to the global food market, and those countries that depend upon that market, data for the top five importers and exporters of four important agricultural commodities (wheat, maize, rice and soybean), for 2001-2010, are marked on the map. This data comes from UN Comtrade.
Water stress
The measure of water stress used is the Adjusted Human Water Security index. This is a frequently used measure of the amount of water available per person. Only the highest water stress levels are shown on the map (corresponding to values of 0.75 and 1 of the index on a 0 to 1 scale), but the full, global pattern of water stress can be found using the link above.
Fragile states
Countries that have appeared in the top ten of the Fund For Peace's Fragile States Index between 2005 and 2013 are marked on the map as a potential indicator of governance challenges within those states. The Fund for Peace is a non-profit and non-governmental research and education institution, and the Fragile States Index is widely used in research and by governments internationally.
Maritime choke points and shipping routes
Seven of the largest maritime choke points are marked on the map, indicating strategically important locations for the transport of goods and trade. These choke points are categorised by the volume of daily transit of oil using data from the U.S. Energy Information Administration.
Similarly, popular shipping routes over the ocean are shown on the map, using data from the National Center for Ecological Analysis and Synthesis.
Transport infrastructure
The location of fixed transport infrastructure is marked to highlight the position of critical global assets.
The top five busiest airports for passenger traffic and the top five busiest airports for cargo traffic for 2010 are marked using data from the Airports Council International.
The top ten busiest ports for 2012 are marked using data from the World Shipping Council.
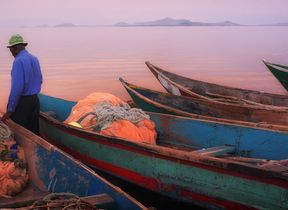
Present-day fish catch
In addition to terrestrial agriculture, fishing is an important component of global food security, so is also included on the map. Volumes of fish catch for 2011 are shown for defined marine fishing regions. This data was sourced from the UN Food and Agriculture Organization.