
HadUK-Grid Overview
An overview of the HadUK-Grid dataset and its purpose.
The primary purpose of these data are to facilitate monitoring of UK climate and research into climate change, impacts and adaptation.
The datasets were created by the Met Office with financial support from the Department for Business, Energy and Industrial Strategy (BEIS) and Department for Environment, Food and Rural Affairs (Defra) in order to support the Public Weather Service Customer Group (PWSCG), the Hadley Centre Climate Programme, and the UK Climate Projections (UKCP18) project.
The data recovery activity has also been funded by the Natural Environment Research Council (NERC grant ref: NE/L01016X/1) project “Analysis of historic drought and water scarcity in the UK”. The dataset is provided under Open Government Licence.
Available data
The HadUK-Grid dataset is generated from digitised historical observational data in the Met Office archives. The gridded data are available back to 1836 for some climate variables, with different lengths of dataset available for different weather observations. The length of the gridded data series is determined by the availability of a sufficient network of stations covering the UK.
HadUK-Grid data are available for a number of different variables, including:
- Daily rainfall: 1891-present
- Daily temperature (max, min): 1960-present
- Monthly/seasonal/annual rainfall: 1836-present
- Monthly/seasonal/annual temperature (max, min, mean): 1884-present.
- Monthly/seasonal/annual sunshine: 1910-present
Data are also available for a number of climatological averaging periods. Further details can be found on the datasets page.
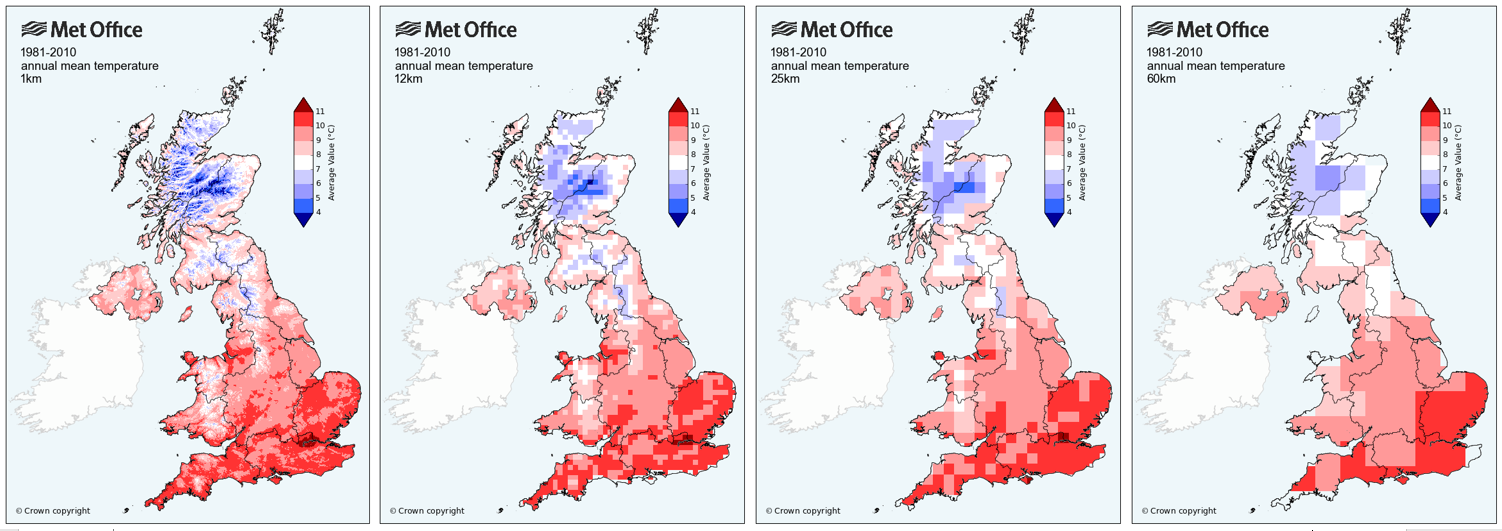
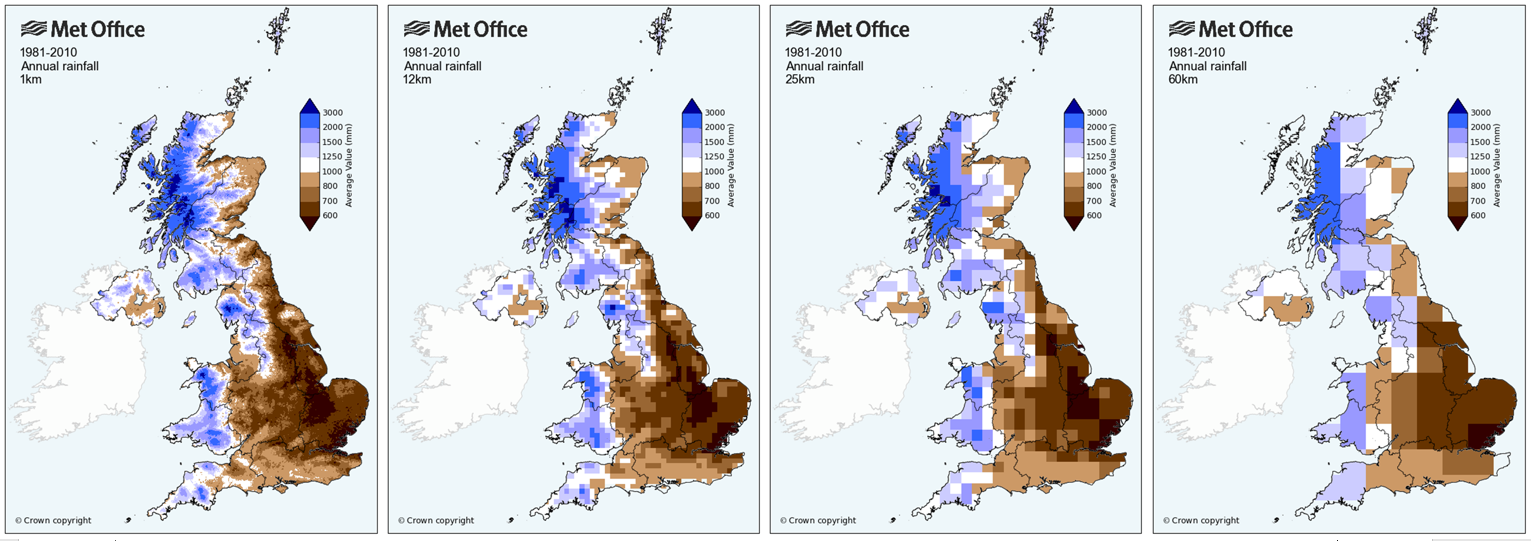
HadUK-Grid is interpolated to a 1km x 1km grid, informed by land surface observations across the UK.
The dataset is also provided at 5km, 12km, 25km, and 60km resolutions to facilitate comparison with climate projections provided by the UKCP18 project. The maps below show 1981-2010 annual mean temperature and rainfall for the UK at 1km, 12km, 25km and 60km resolutions.
Publication timeline
The HadUK-Grid dataset is regenerated each year. This allows us not only to add data for the most recent calendar year but also to incrementally improve the entire dataset by, for example, incorporating newly digitised historical data or improved analysis methods.
Each annual release is made available on the CEDA Archive. There is no fixed publication schedule but typically the latest version will be uploaded during the second quarter of the year.
The State of the UK Climate report is published each year towards the end of July. This report is based on the latest version of HadUK-Grid.
For users that require more timely access, provisional versions of a subset of the HadUK-Grid data products are available to download from the Met Office website. The provisional data are available within about a week of the end of each month.