Satellite image of the month - 2017
Showcasing some of the Met Office's satellite imagery from around the world showing weather in action, new views of the world and extra commentary on how we collect and create the images from our Satellite Applications team.
December 2017: Snow in the UK
Mid-December 2017
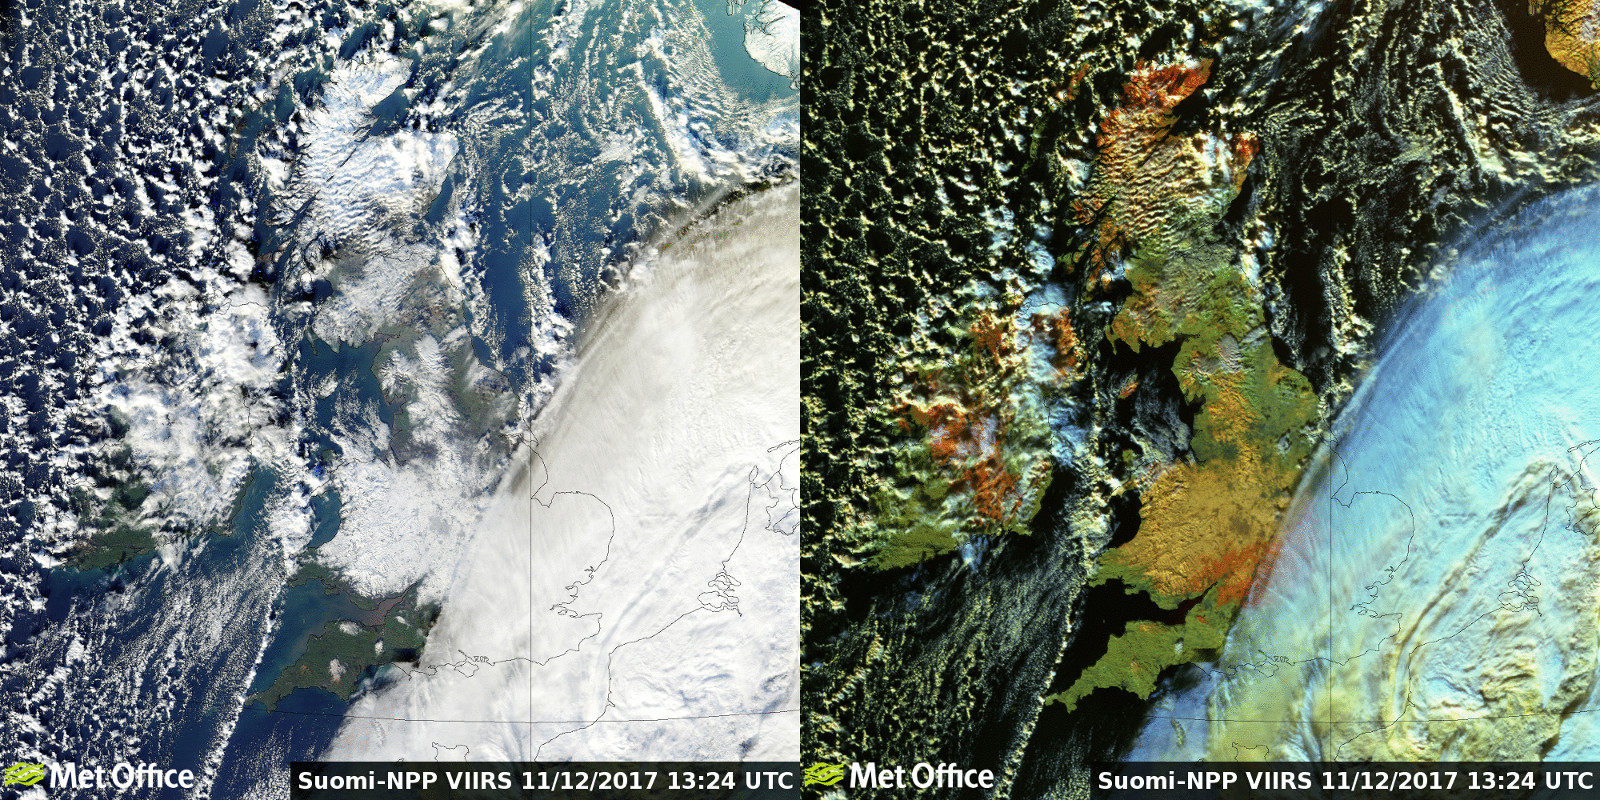
Heavy snowfall over parts of the UK in mid-December led to disruption including school closures and power-cuts. The two images above show two different views from the VIIRS instrument aboard the NOAA/NASA satellite, Suomi-NPP. We create both images from data collected at the same time as the satellite passed over the UK on 11th December at an altitude of around 830 km. The first is a 'true-colour' image, familiar as it uses three visible channels on the satellite to produce an image, as it would appear to the human eye. The problem with this is the clouds are white and snow on the ground is white, so it can be hard to tell them apart. The second image aims to solve this problem. It uses five channels in the near-infra-red part of the spectrum to construct an image in which the snow can be differentiated from the cloud. Snow lying on the ground appears in an orange colour, while cloud ranges between blue, white and yellow depending on the cloud properties. Where there is thick cloud it is not possible to tell if there is snow underneath using these images.
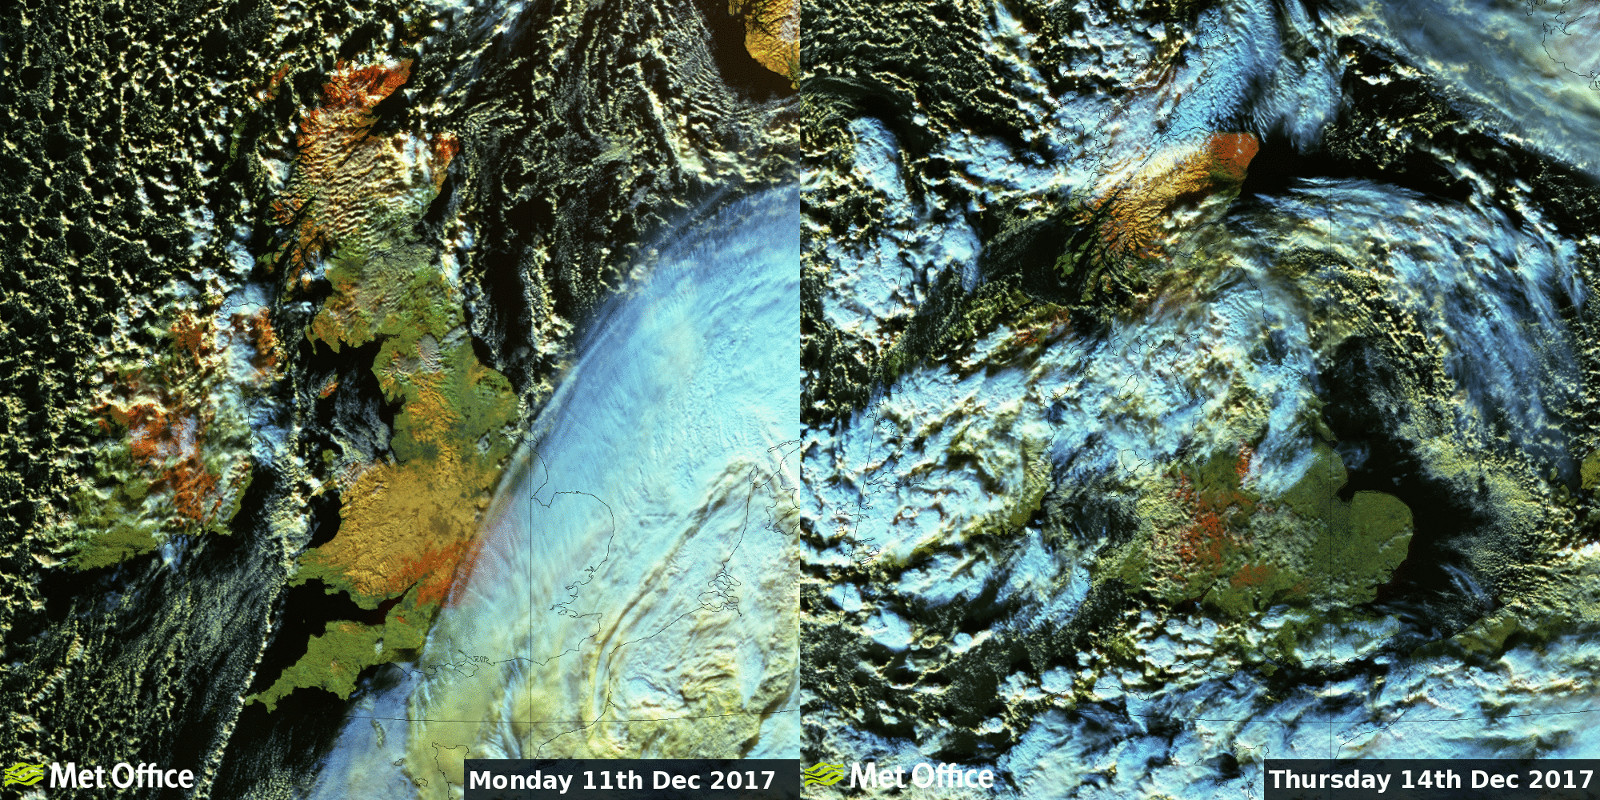
In the two images below, the first image is the same 5-channel snow image in the picture above and the second image is the 5-channel snow image from three days later, showing how much less of the ground is covered in snow. There are enough gaps in the cloud to see that a significant amount of the snow across Wales and the Midlands has melted.
November 2017: Cyclone Numa, A Mediterranean tropical-like cyclone (medicane)
18 November 2017
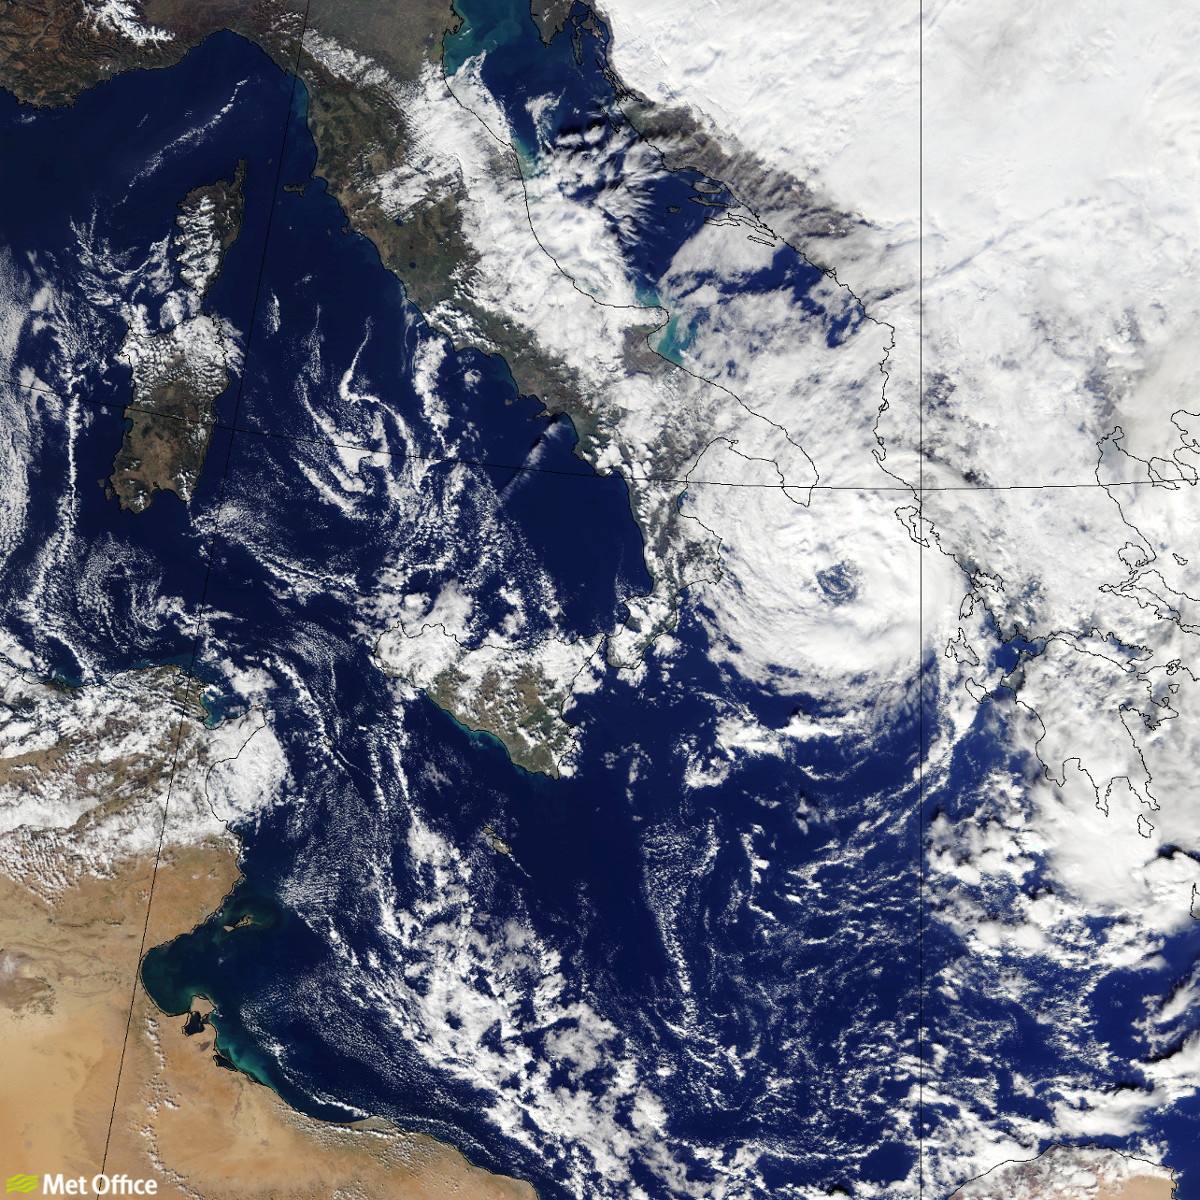
A relatively rare occurrence in the Mediterranean is the formation of a cyclone with tropical cyclone characteristics, sometimes called a medicane.
At the time of this image on 18th November, Numa had recently reached peak intensity and had developed a clear, well-defined eye structure. Wind speeds were measured by the ASCAT satellite instrument* to be at Tropical storm intensity, sustaining winds of 55 knots (63 mph). The system soon lost its Hurricane-like appearance but went on to cause heavy rainfall and flooding over Greece and other parts of Southern Europe.
This is a true-colour visible image created from data captured by the VIIRS instrument on the NOAA/NASA Suomi NPP satellite. This is a polar-orbiting satellite which circles the Earth every 101 minutes at an altitude of over 830 km. The satellite instrument detects up-welling radiation from the Earth and atmosphere. The next satellite in this series, JPSS-1, was launched this month and reached orbit on the day this image was taken. Please see our blog to find out more about JPSS-1.
*See September 2017 image for more details on ASCAT.
Credits: Met Office (image) , NOAA/NASA (data).
October 2017 - Saharan dust and Iberian wildfire smoke brought over the UK by Ex-Hurricane Ophelia.
16 October 2017
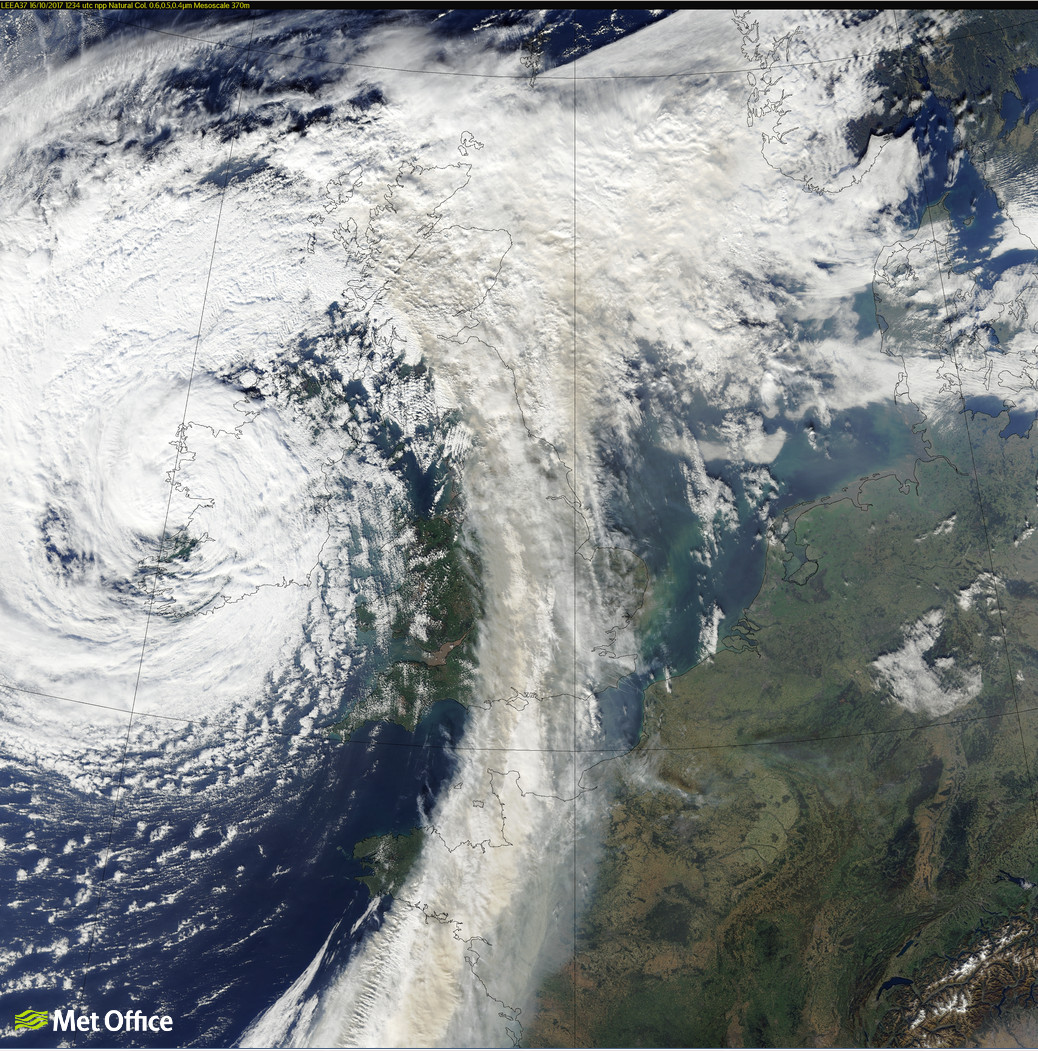
There are numerous tales in folklore as to why a rising sun may appear red in a yellow sky. This satellite image gives some evidence as to the real reason why many people in the UK saw this phenomenon on the morning of 16 October. Ex-hurricane Ophelia, passing eastwards, picked up Saharan dust and smoke from wildfires in Portugal and transported it over the UK. This true-colour image from the VIIRS instrument on the NOAA/NASA Suomi NPP satellite shows this happening. The cloud stretching over the western edge of Europe contains a lot of these dust and smoke particles, making the cloud appear a 'dirty' brown/yellow in the image. Three visible channels from the satellite imager, which correspond to the red, green and blue parts of the visible spectrum, are combined to make a true-colour image, representative of what would be seen by the human eye. This satellite image also shows the spiral shape of cloud associated with the anti-cyclonic low-pressure system, the remnants of Opehlia, the easternmost major Atlantic hurricane on record.
The colours observed in the UK were a result of the dust and smoke in the atmosphere scattering the light from the rising sun. Particles of this size scatter more radiation from the blue part of the spectrum so that more of the red/yellow wavelengths of light will reach the eyes of an observer on the ground.
Some photos from the ground were posted on @MetOffice on the day: https://twitter.com/metoffice/status/919953784146747392
Credits: Met Office (image) , NOAA/NASA (data).
September 2017: Scatterometer detection of Hurricane Irma
8 September 2017
Hurricane Irma caused widespread devastation in the northeastern Caribbean, Cuba and Florida during the first half of September 2017. Irma sustained maximum wind speeds of 185 mph over a period 37 hours – the longest any cyclone around the globe has maintained that intensity on record (P. Klotzbach, Colorado State University).
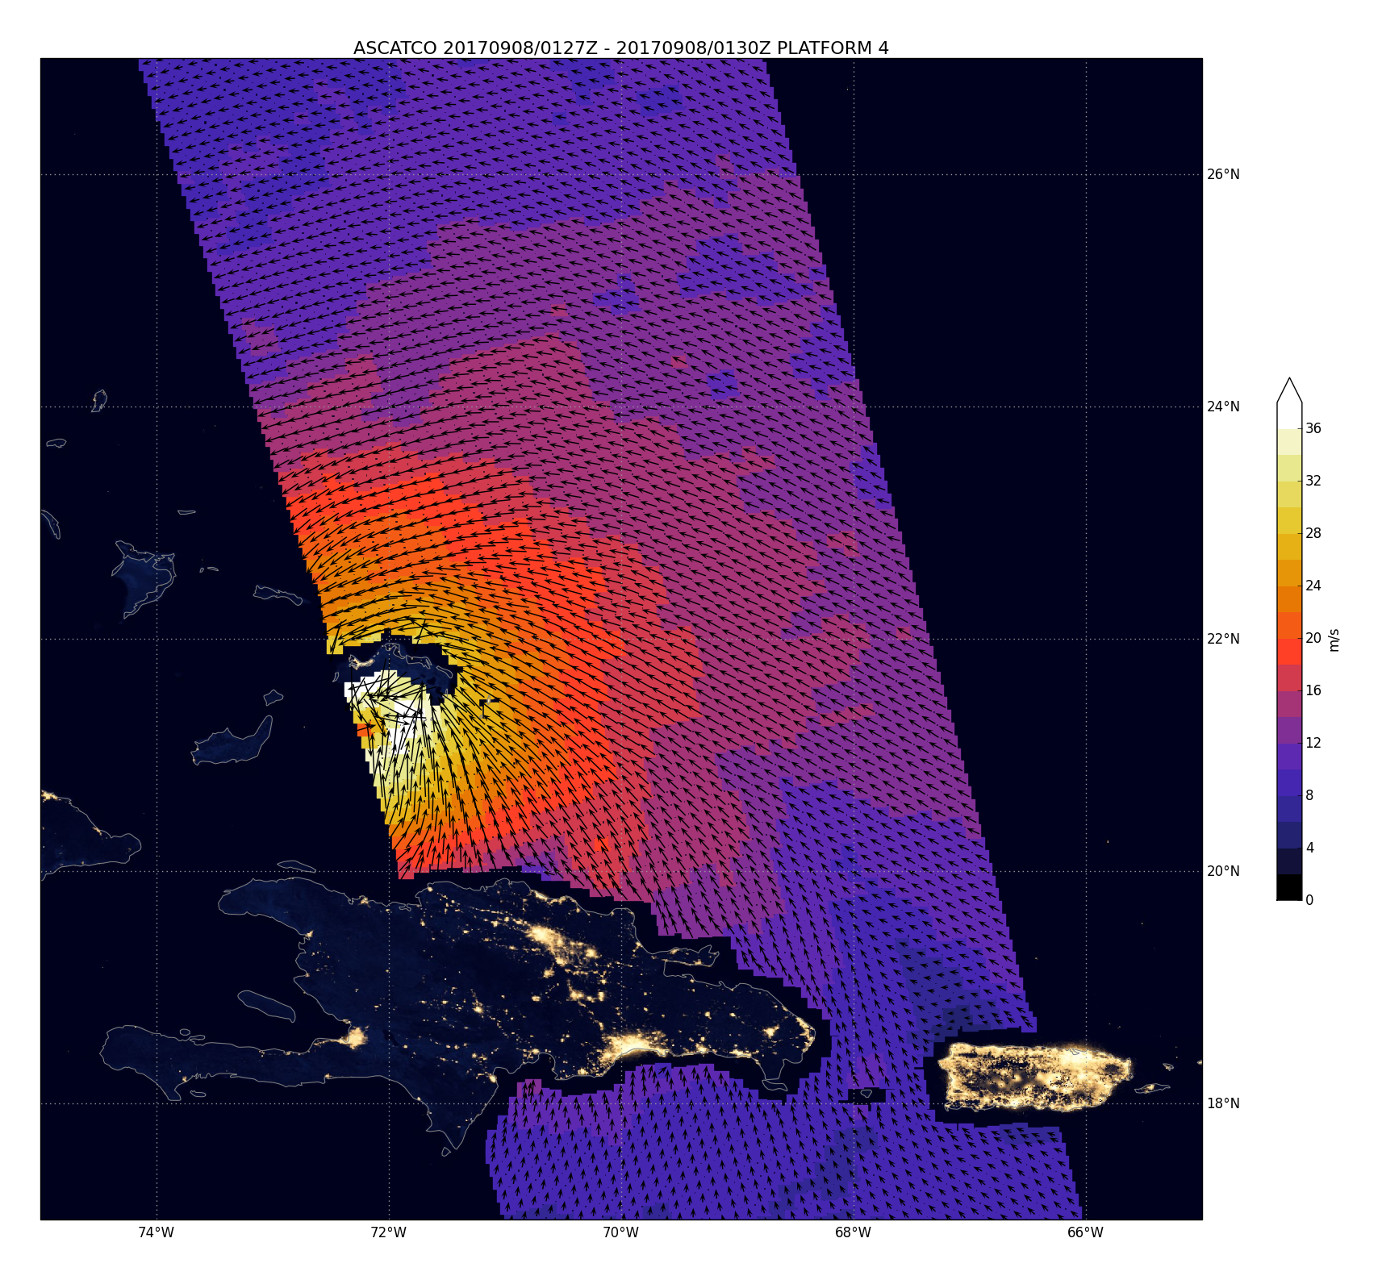
The image above shows the surface winds circulating around Irma as the storm passed near the Turks and Caicos Islands at around 0130 UTC on the 8 September. At this time Irma was classified as Category 5 hurricane on the Saffir-Simpson hurricane wind scale. The colours on the map indicate the strength of the wind speed; white shades represent the strongest (hurricane force) winds located near the storm’s eye-wall, whilst the arrows show the wind direction.
The wind data are taken from the Advanced Scatterometer (ASCAT) instrument on-board the Metop-A satellite. From an orbit of over 800 km above the Earth’s surface ASCAT cannot measure the wind directly. Instead the radar sends down pulses of microwave energy and measures the return signal which is backscattered from the ocean surface. As the wind strength increases the ocean surface becomes rougher and more energy is backscattered towards the satellite. By taking multiple measurements of the same patch of ocean an estimate of the surface (10 m height) wind speed and direction can be made.
Credits:
ASCAT data - EUMETSAT/KNMI
Background image- VIIRS city lights (NOAA/NASA)
August 2017: Total solar eclipse over North America
21 August 2017
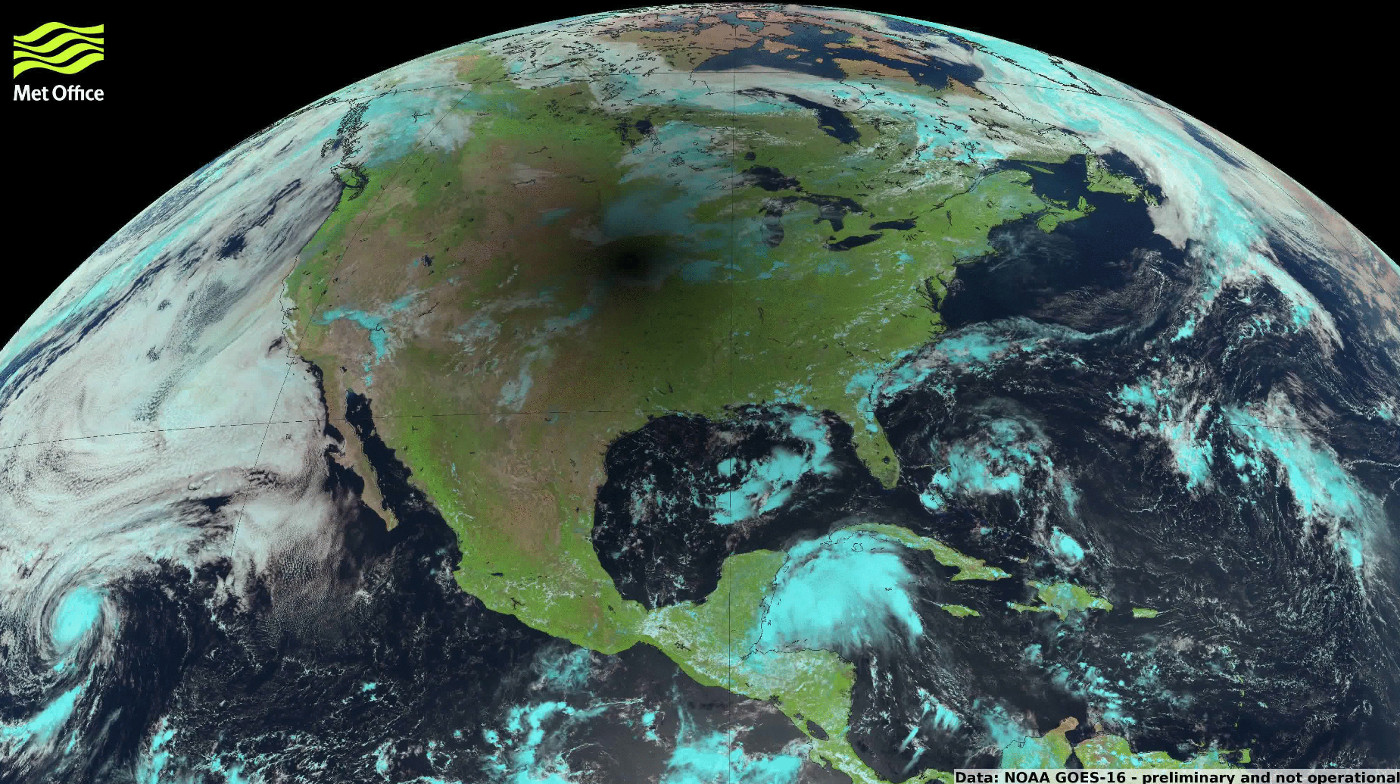
Much of the US experienced clear skies on 21st August 2017 as the shadow of the solar eclipse passed from the West to the East coast, from Oregon to South Carolina. GOES-16, the latest US geostationary satellite operated by NOAA, captured the event. Also in these images Hurricane Kenneth can be seen spinning in the North Pacific. GOES-16, 36,000 km above the Earth's surface, will become operational later this year. It is in a geostationary orbit so remains above the same point of the Earth. The Advanced Baseline Imager (ABI) aboard GOES-16 provides imagery from 16 spectral bands at much higher spatial resolution and more frequently than it's predecessors. Five minute imagery over the continental US is viewable in this external link provided by RAMMB/CIRA: http://col.st/QrNDd.
The image here combines 3 channels at visible and near-infra-red wavelengths to provide a view near to what the human eye would see, except ice clouds show up as a cyan colour. This is useful characteristic as it allows forecasters to distinguish between ice and water clouds.
July 2017: Eight Tropical Cylones in North Pacific
22 July 2017
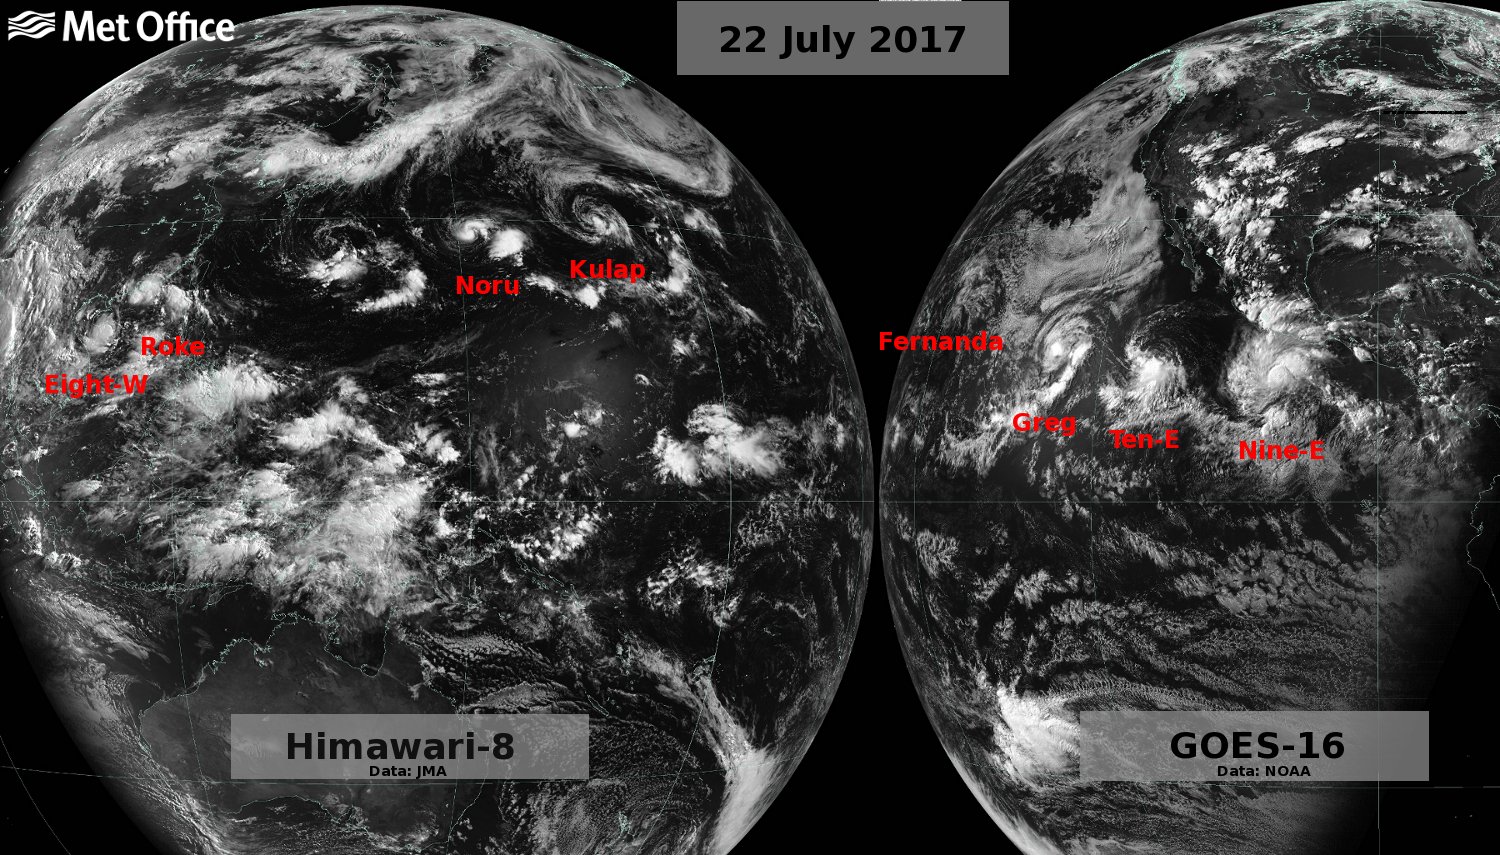
For the first time in over forty years, 8 Tropical cyclones were spinning simultaneously over the Pacific ocean. 22nd July 2017 was the first occurrence of this since 1974.
Two of the new generation of geostationary satellite imagers captured this rare event. The visible channel images above are both from 23:30 UTC on 22 July 2017. The Advanced Himawari Imager on-board Himawari-8, a Japanese Meteorological agency satellite, captured the four in the Western Pacific: Noru, Kulap, Roke and Tropical Depression Eight-W, which later became Tropical Storm Sonca. Noru later became a Super Typhoon. The newest US geostationary weather satellite, GOES-16, operated by NOAA, captured the Tropical Cyclones in the Eastern Pacific: (ex-hurricane) Fernanda, Greg, Tropical Depression Nine-E and Tropical Depression Ten-E. Nine-E later became Hurricane Hilary and Ten-E became Hurricane Irwin. Data from GOES-16 is currently in a pre-operational phase.
April 2017: Large dust outbreak in the Atlantic
April 2017 - Saharan dust being transported over the Atlantic
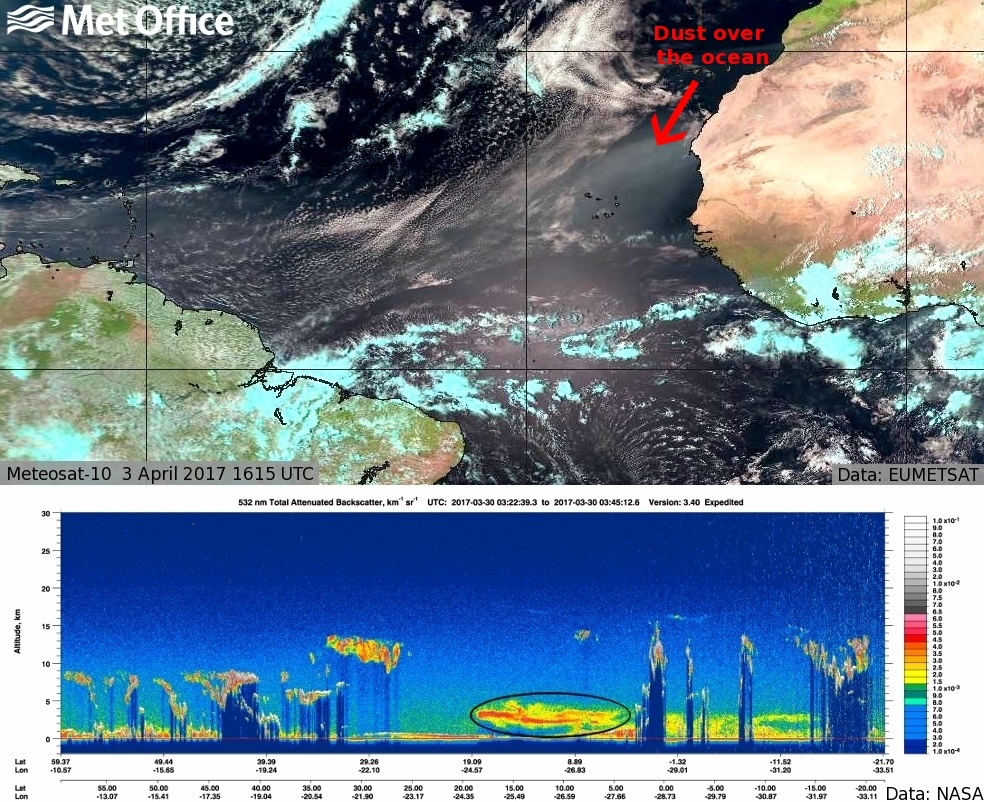
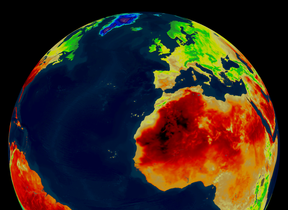
For a period in early April, scientists in Satellite Applications at the Met Office observed a Saharan dust outbreak off the West coast of Africa. Between 60-200 million tons of dust are typically lifted every year in the Sahara region up to 5 or 6 km in altitude, and most of it is transported by the trade winds across the Atlantic all the way to the American continent. Occasionally, dust plumes may also reach the United Kingdom. Dust affects radiation in the atmosphere. The dust combined with the hot and dry air of the Sahara forms the Saharan Air Layer over the Atlantic Ocean, which has significant effects on tropical weather and interferes with the development of hurricanes. Dust also acts as a nutrient source for oceanic microorganisms and it can favour the formation of ice clouds. Large uncertainties exist in the exact properties and the quantification of atmospheric dust. Since 2011, dust is predicted in the Met Office global forecast model.
There is a large year to year variability in the dust transport across the Atlantic, generally towards the Caribbean, but in the winter and spring also towards South America. African dust has been shown to be a major contributor to soils in the receptor regions, and is believed to be a major source of nutrients for the Amazon River Basin, mainly due to its content of minerals and phosphorous.
This event, of intensity larger than usual, shows a week-long episode of dust transport from West Africa to South America. It has been followed using passive and active satellite sensors. It is well observed from the EUMETSAT geostationary satellite Meteosat-10, as seen in the top image, which is a 3-channel 'Natural Colour' image from 3 April 2017 at 16:15 UTC. The dust crossing the Atlantic is highlighted as a brown/yellow haze against the dark oceanic background.
The lower image shows the dust plume as highlighted with the NASA space lidar CALIOP (circled). In lidar imagery, the vertical dimension is height above sea level and the horizontal dimension is the location of the satellite as it follows its orbit around the Earth. This image was acquired on 30 March 2017 at 03:45 UTC.
March 2017: Cyclone Enawo.
7 March 2017
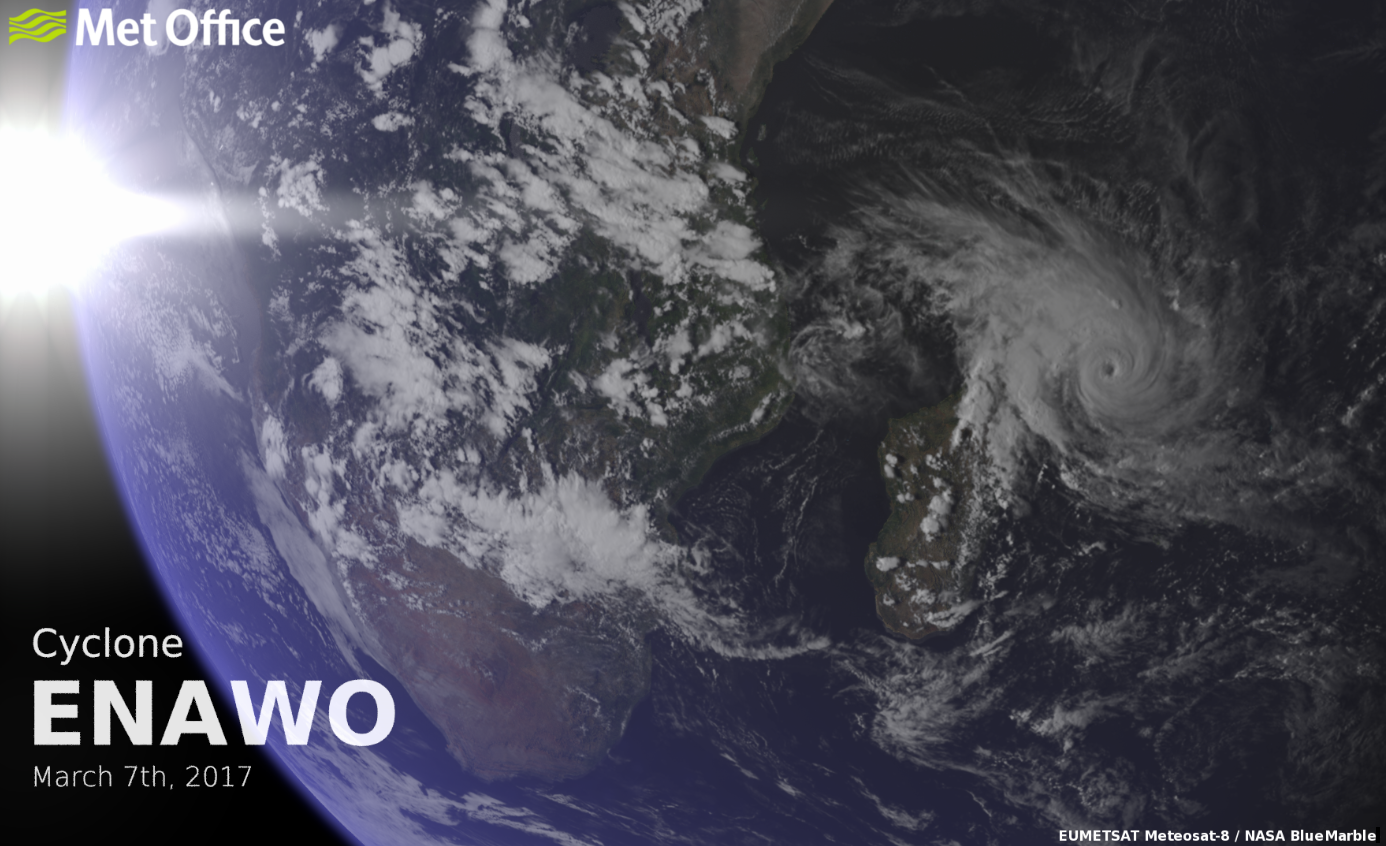
EUMETSAT's Meteosat-8 geostationary satellite has been moved to replace the aging Meteosat-7 and provide coverage centering on the Indian Ocean region. The image above, created at the Met Office, is a composite image. The clouds in the image are taken from a visible channel (at 0.6 μm) of the Spinning Enhanced Visible and InfraRed Imager (SEVIRI) on Meteosat-8. This is overlaid on NASA Blue Marble imagery, which provides the land and sea surface background.
The image shows Cyclone Enawo on 7th March, the time when it reached peak intensity just before making landfall on Madagascar.
February 2017: Green Lake Maracaibo, Venezuela - duckweed outbreak
20 February 2017
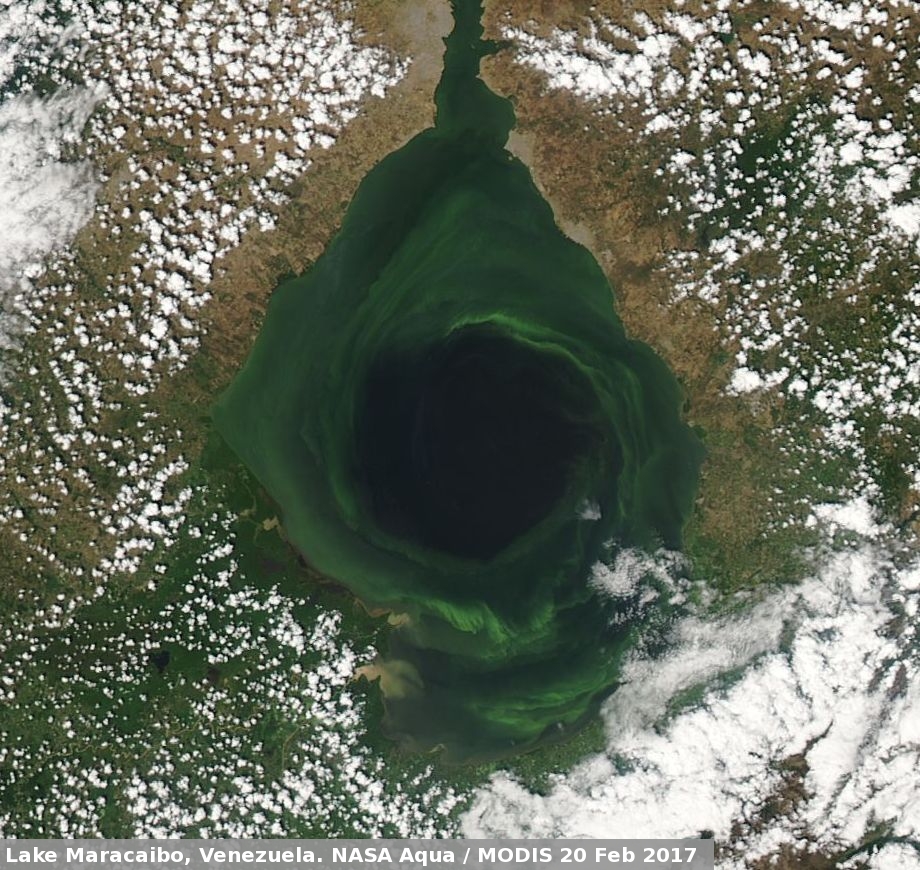
Looking like a great, green swirling eye from space, this is in fact an outbreak of duckweed on Venezuela’s Lake Maracaibo. The lake is brackish, connected to the Caribbean Sea by a narrow channel. During heavy rains, mixing of the fresh rain water with the salty lake water can cause the duckweed, already present in the lake, to rapidly increase in amount giving the vibrant green colour. The influx of sea water through the channel causes currents in the lake giving the swirling appearance.
The Moderate-resolution Imaging Spectroradiometer (MODIS) on board NASA's Aqua satellite provides useful information on changes to the Earth's surface as well as information on atmospheric dynamics, water vapour, cloud and aerosols. This is a true-colour image, combining information from three visible channels on the instrument to give an image as it would appear to the human eye.
January 2017: Two images, one day apart, from NASA's Terra Satellite.
25 January 2017 - Rare snowfall over the Sahara Desert
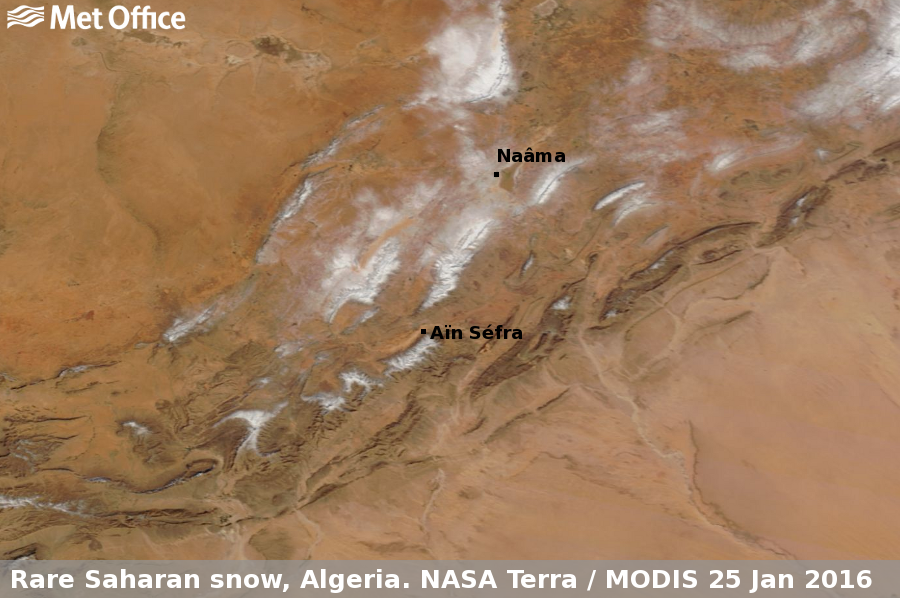
December 2016 saw what was reported as the first snow in the Sahara desert for 37 years. The snowfall continued in January, completely covering some dunes and creating waist high drifts. This remarkable occurrence can be seen in this high resolution image, created using data from NASA’s Terra satellite, from over 700km above.
26 January 2017 - Chile wildfires
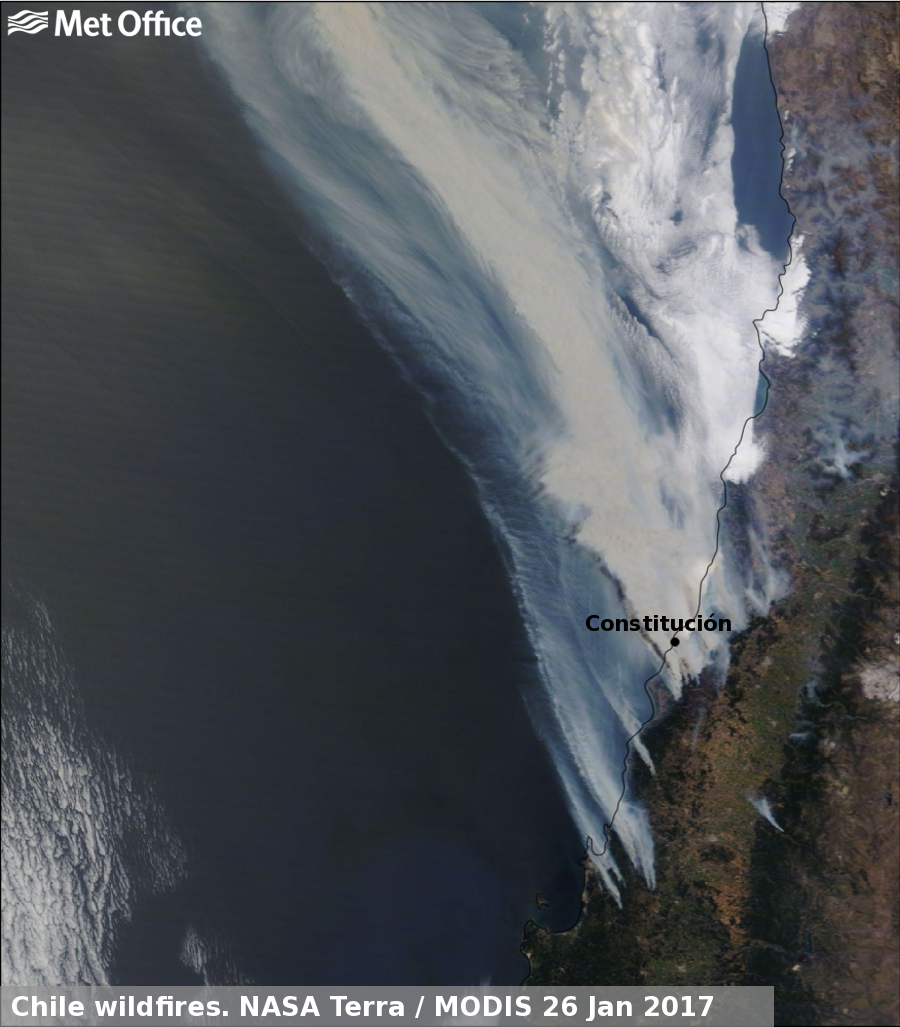
Drought conditions and high temperatures in Chile's central Maule region in January led to the rapid spread of wildfires, causing a state of emergency to be declared as the fires caused widespread destruction and deaths. The image above shows the extent of the fires and smoke on 26 January.
NASA's Terra satellite contains a Moderate-resolution Imaging Spectroradiometer (MODIS). This instrument measures incoming radiation from the Earth and it's atmosphere as it orbits 710 km above the surface of the Earth. Each orbit takes 99 minutes to complete. If we combine the measurements from three visible wavelengths, corresponding to red light, green light and blue light, we can create a 'true colour' image which looks like a photograph.