Satellite image of the month - 2019
Showcasing some of the Met Office's satellite imagery from around the world showing weather in action, new views of the world and extra commentary on how we collect and create the images from our Satellite Applications team.
December 2019 - Record breaking cold temperatures in Delhi under extensive fog
30 December 2019
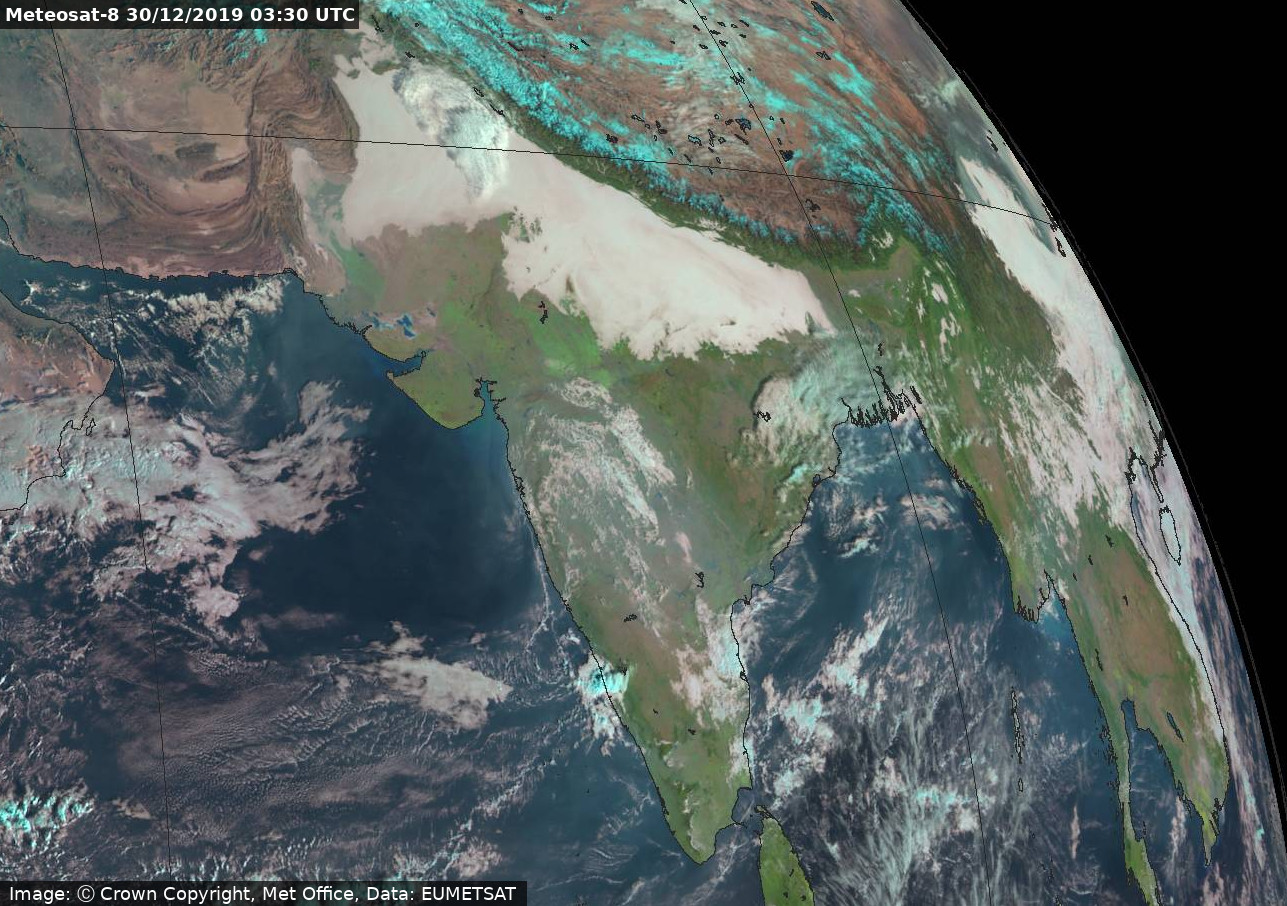
In this image from 30 December, a layer of fog covers northern India and Pakistan. A severe cold spell across the region led to temperatures in Delhi being the coldest ever recorded since records began in 1901. Temperatures in the city dropped to 9.4°C under thick fog mixed with air pollution.
This is an image created using data from the Spinning Enhanced Visible and InfraRed Imager (SEVIRI) instrument onboard Meteosat-8, a EUMETSAT geostationary satellite providing coverage over the Indian Ocean region. From this viewpoint at 35,000 km above the Equator the extent of the fog can clearly be seen. Using data from channels detecting radiation at visible and near infra-red wavelengths we can produce an image that is close to true colour, however ice clouds and snow on the ground appear as a shade of cyan. Water cloud appears various shades of white and the fog here appears as a large off-white coloured patch, smooth and less textured than the higher convective and stratiform clouds in the image. The fog is bounded by the snow-covered high peaks of the Himalayas to the North (in a cyan colour) and mountainous plateaus of Pakistan to the West.
Credits: Image: © Crown copyright, Met Office, Data: EUMETSAT
November 2019 - Australian wildfires & very cold cloud tops
30 November 2019
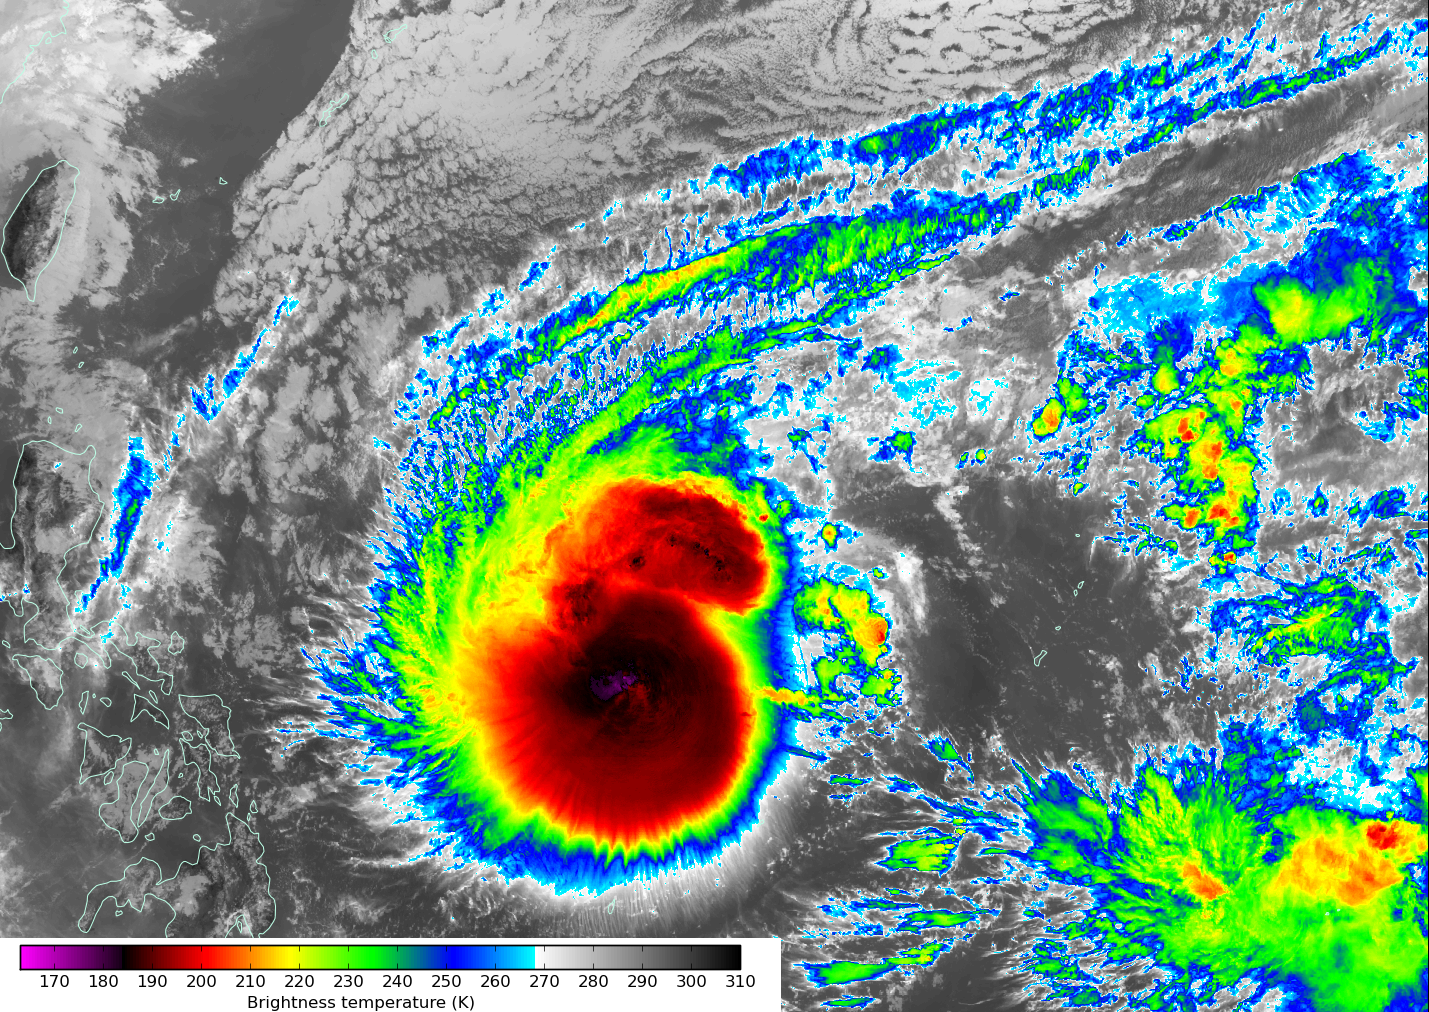
Shortly before reaching the Philippines, Typhoon Kammuri produced some incredibly low cloud-top temperatures. Temperatures of -109.4°C were sensed by the Visible Infrared Imaging Radiometer Suite (VIIRS) onboard NOAA-20, a NOAA/NASA operated polar-orbiting satellite. Investigations by specialists at SSEC, University of Wisconsin suggest that this would qualify as the coldest cloud-top temperature on record as sensed by a satellite.
These cold cloud-top temperatures came about due to an effect called 'central cold cover' - something fairly unusual and first discussed in a 1984 publication on tropical cyclone satellite analysis by Dvorak*.
The satellite image above shows infra-red brightness temperature as sensed by Himawari-8, a Japanese geostationary satellite. It was captured minutes before the lowest VIIRS measurement. The colour scale shows the very coldest cloud-tops as a bright purple colour. Near the centre of Typhoon Kammuri temperatures of below -100°C (173.15 K) can be seen.
For more information see the SSEC blog.
* Dvorak, V.F., 1984. Tropical cyclone intensity analysis using satellite data (Vol. 11). US Department of Commerce, National Oceanic and Atmospheric Administration, National Environmental Satellite, Data, and Information Service.
Credits: Image: © Crown copyright, Met Office, Data: JMA
8 November 2019
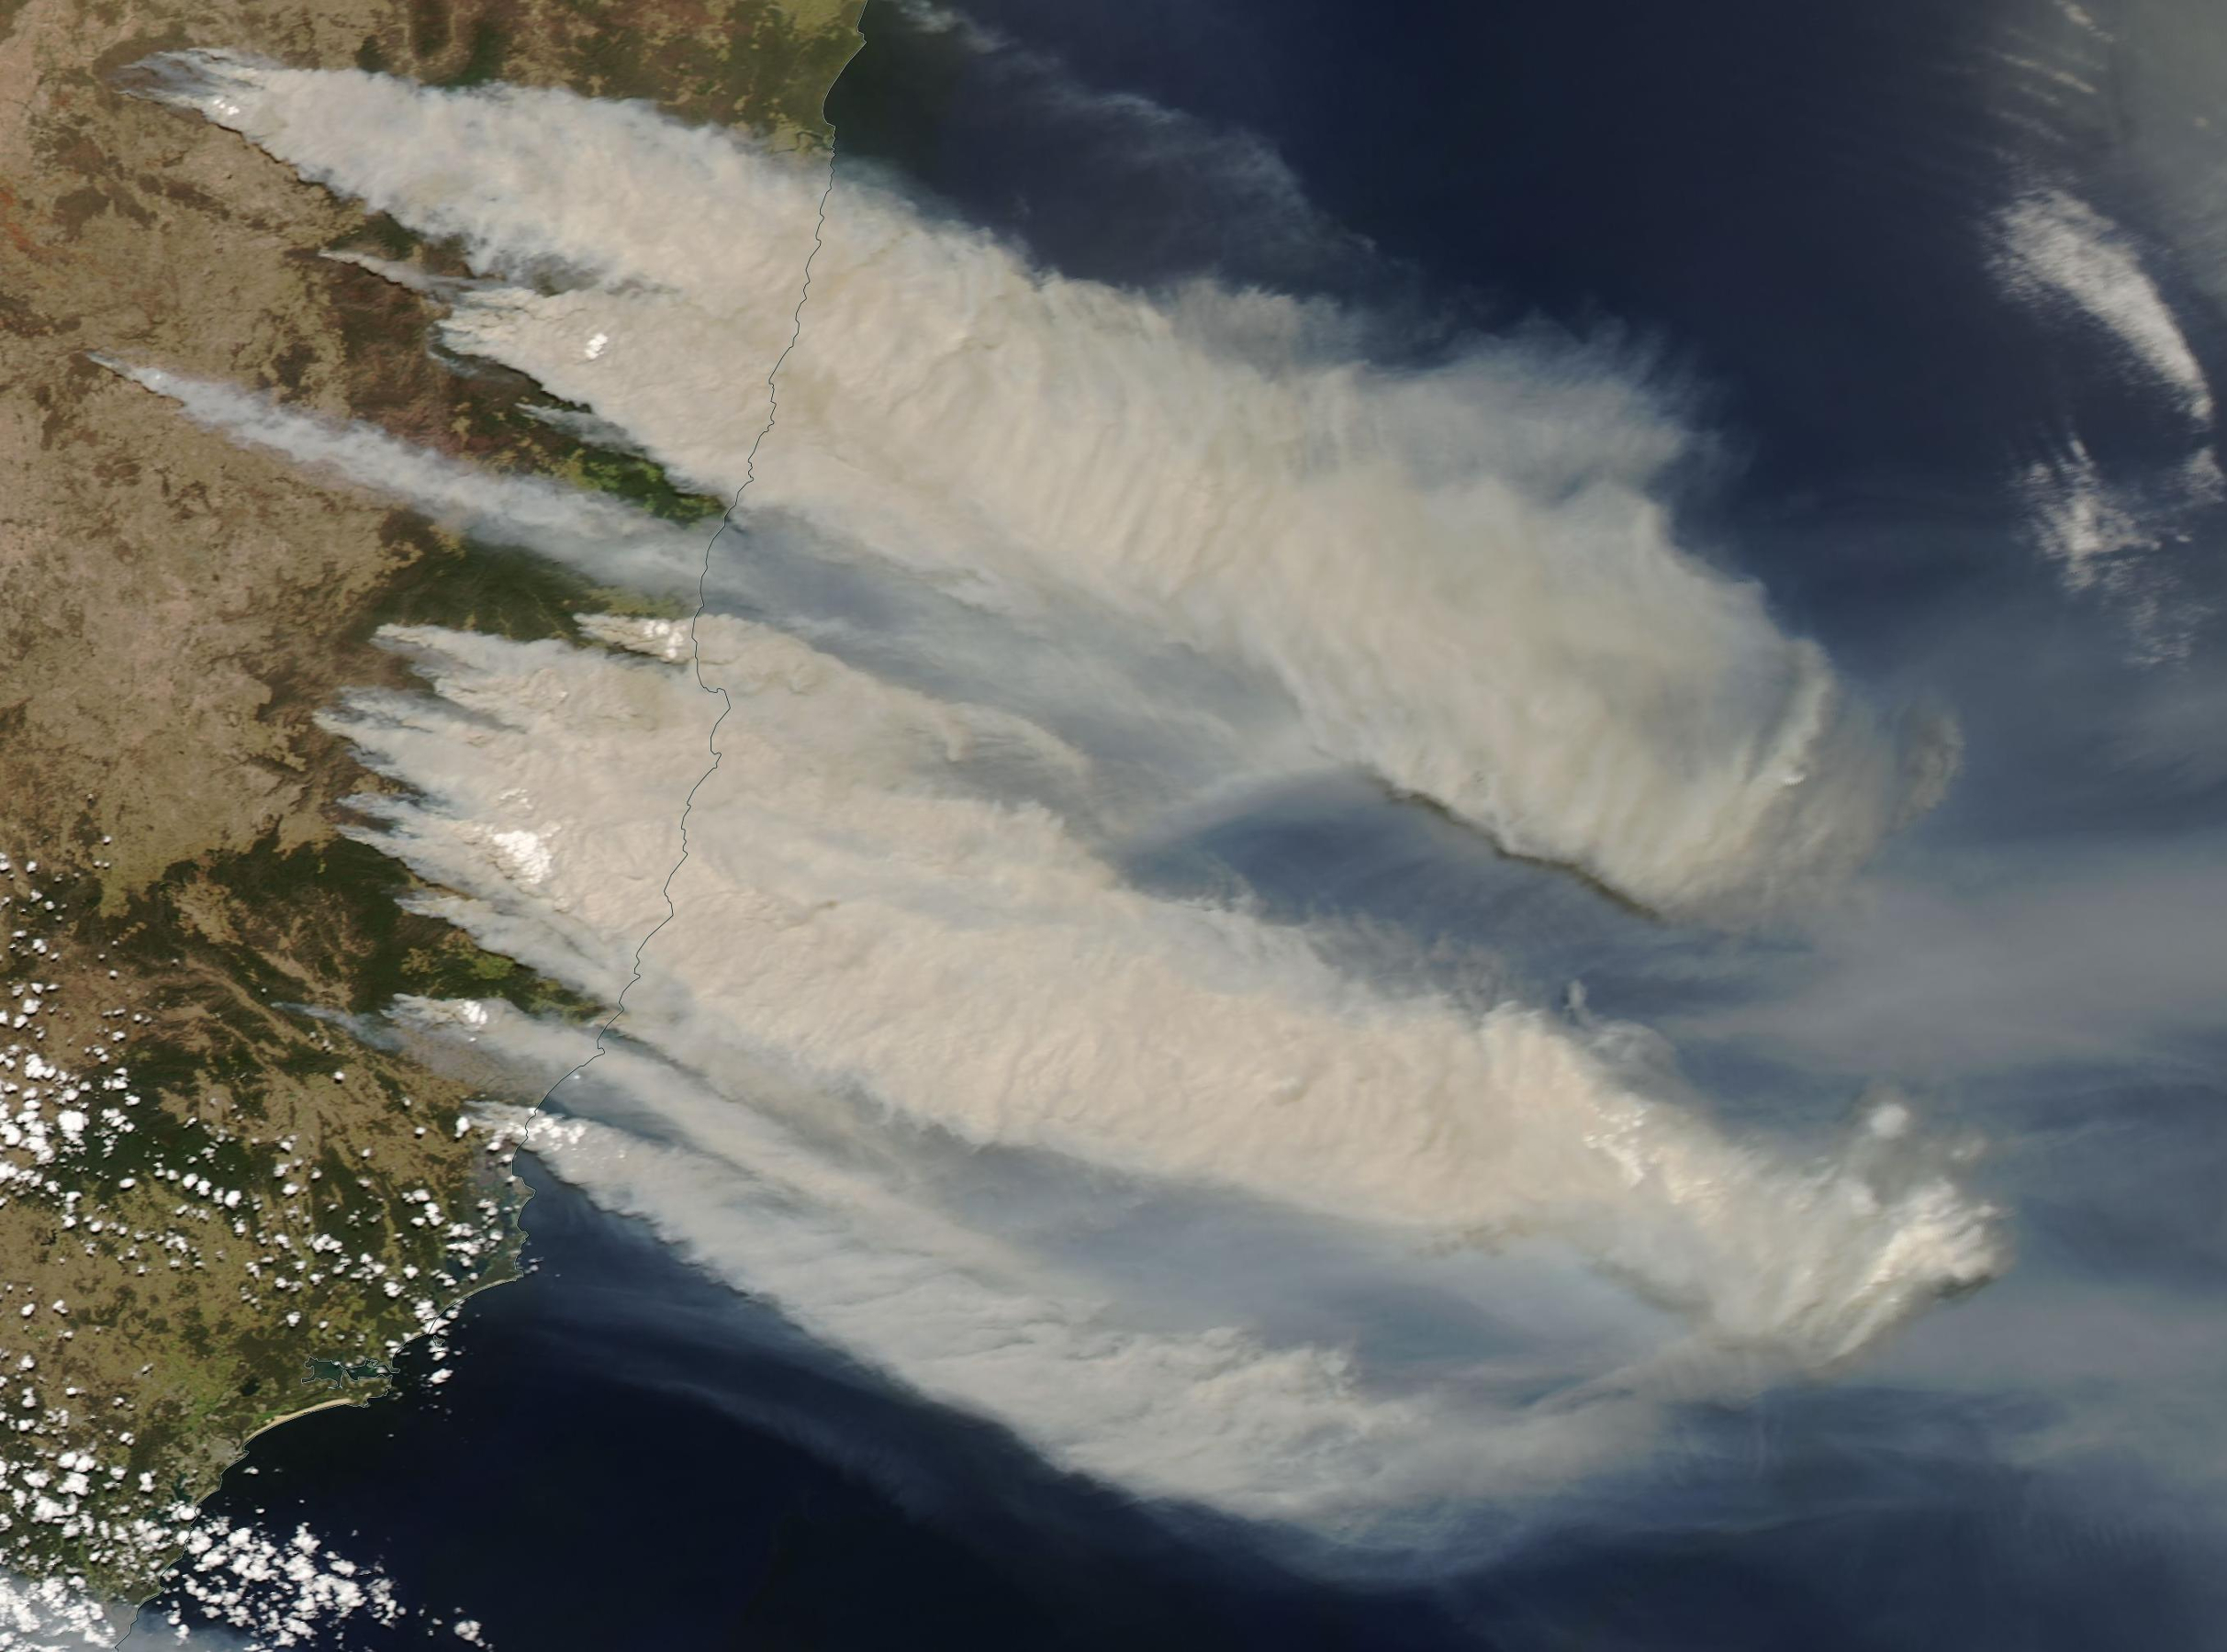
Extensive and devastating wildfires burned in eastern Australia for most of November (and beyond). This is a true colour image of the region on 8th November from NASA's Aqua satellite. The image is dominated by the brown smoke plumes from numerous fires. Also seen within the plumes are white pyrocumulus clouds (Cumulus Flammagenitus) where convection from the intense heat of the fires causes cumulus clouds to form above the smoke plumes.
Credits: Image: NASA Aqua
October 2019 - Aurora Borealis
29 October 2019
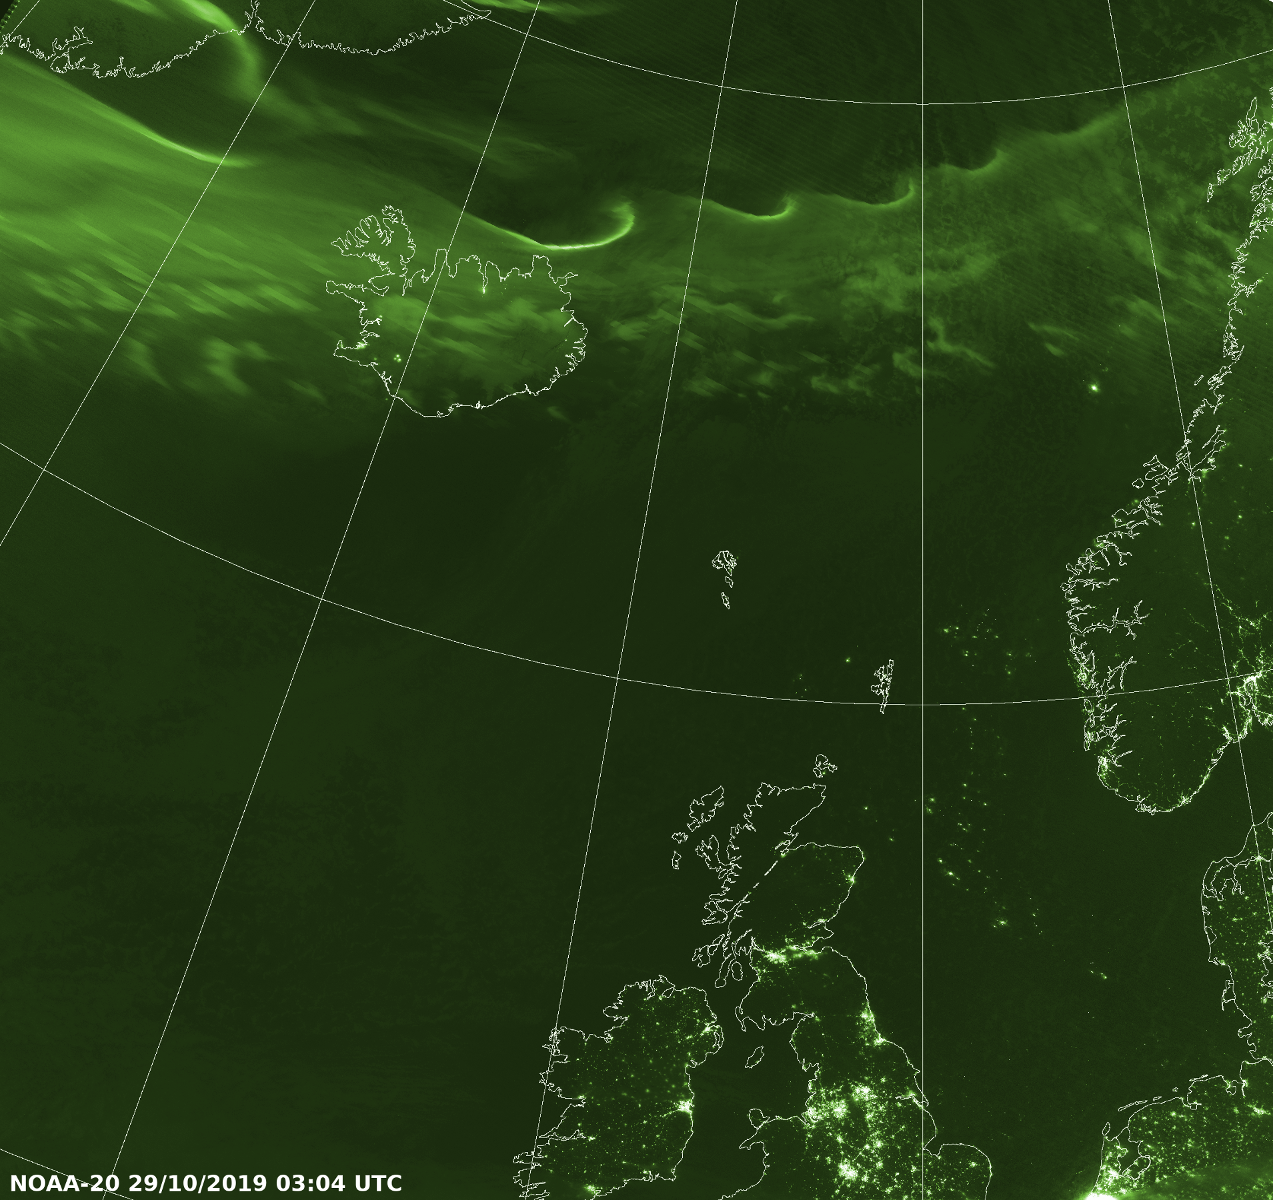
A night-time image from the day-night band of the VIIRS instrument on the NOAA-20 polar-orbiting satellite shows a spectacular Aurora Borealis to the North of Iceland (as the brighter green swathe near the top of the image). This band of the satellite instrument detects very low light levels at night-time. The Aurora in this case has an attractive 'scalloped' pattern. City lights, roads and oil platforms can also be seen further south. The green colouration used in this image is chosen to highlight the brighter parts of the image effectively.
Credits: Image: © Crown copyright, Met Office, Data: NOAA/NASA
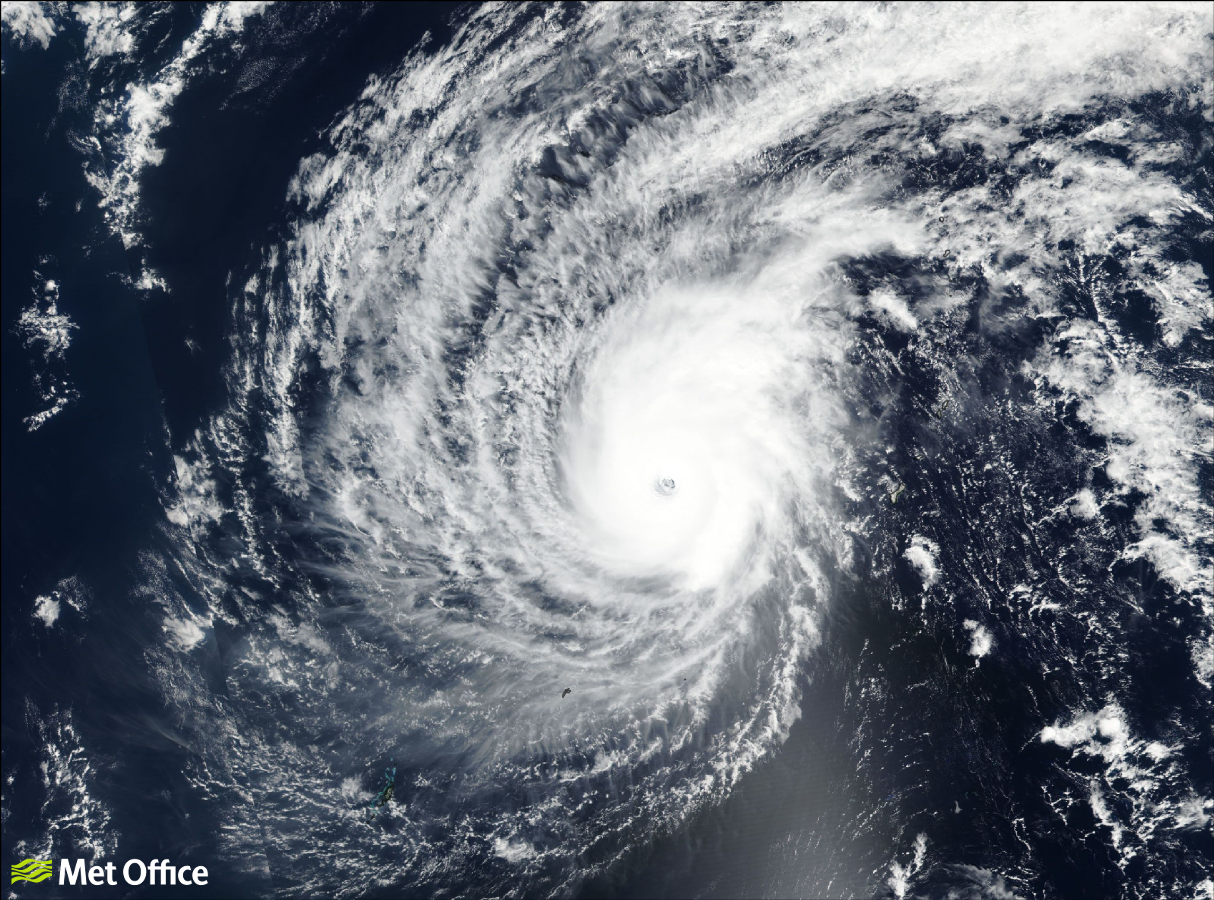
September 2019 - Hurricane Lorenzo
29 September 2019
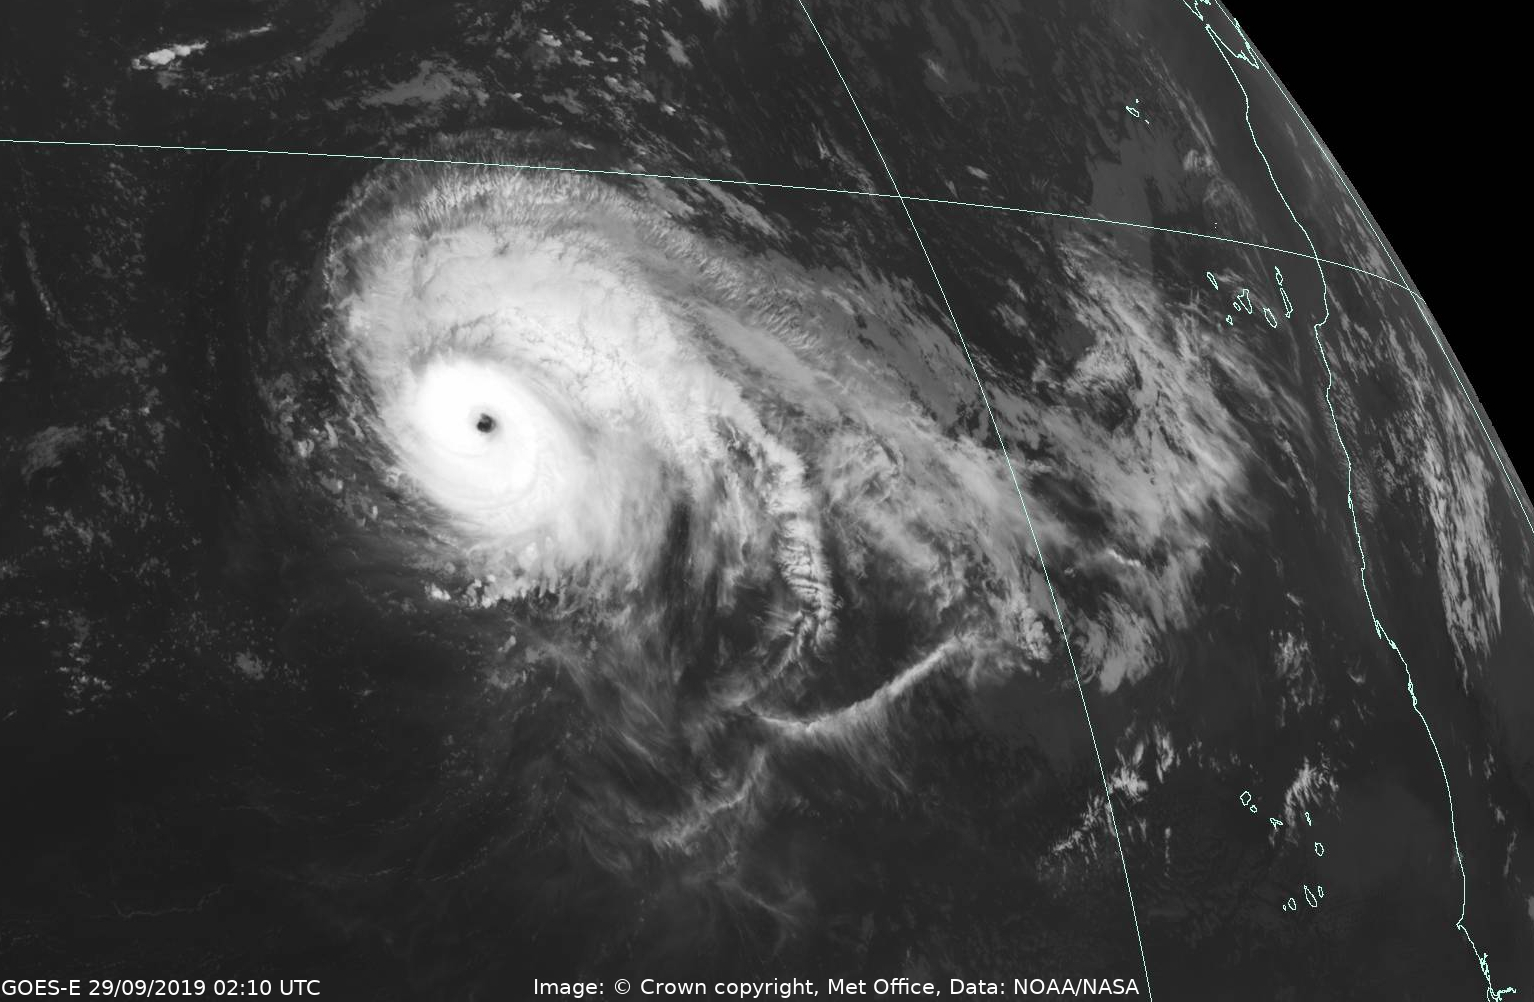
Hurricane Lorenzo was an unusual Atlantic Tropical Cyclone because it reached peak intensity so far east. With maximum sustained wind speeds of 260 km/h (160 mph) and a minimum central pressure of 925 hPa, it reached extremely dangerous Category 5 status at 24.1 N, 45.0 W. Lorenzo became the strongest hurricane ever recorded this far north and east in the Atlantic basin.
This infra-red satellite image shows the hurricane just as the US National Hurricane Center confirmed that Lorenzo had reached Category 5 status, 02:10 UTC on 29th September. The NOAA/NASA geostationary satellite GOES-16 (GOES-East) provided the measurements of infra-red brightness temperature which were used to make this image.
After bringing hurricane force winds to the Western Azores, Lorenzo transitioned to an extratropical cyclone in early October and the remnants of the storm bought bad weather to Ireland and parts of the UK in the following days.
Credits: Image: © Crown copyright, Met Office, Data: NOAA/NASA
August 2019 - Volcanic rock afloat from underwater eruption near Tonga
9-11 August 2019
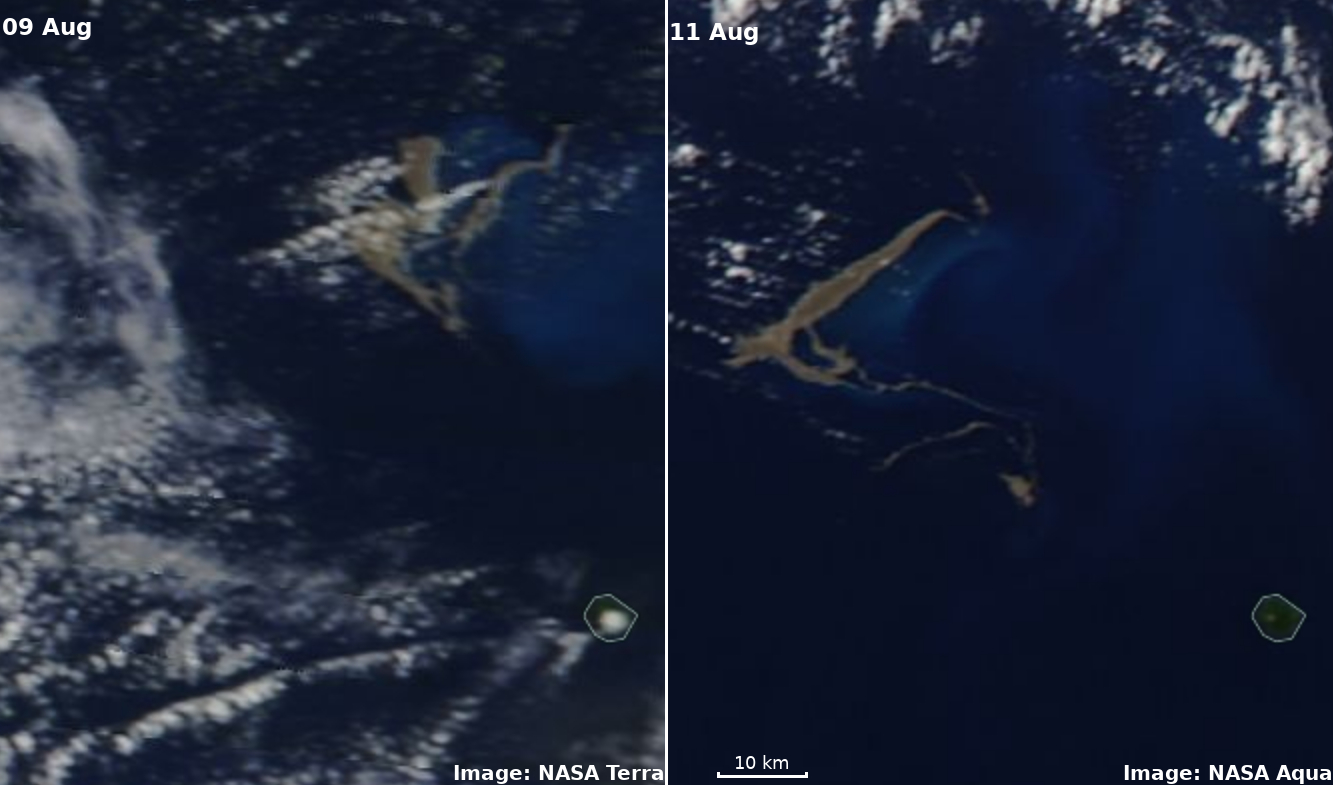
Whilst these images are taken from weather satellites they have more to do with volcanology than meteorology. On 7 August an unnamed underwater volcano erupted near Tonga. Satellite images on 9 August revealed a giant ‘raft’ of floating volcanic rock in the South Pacific Sea. These remarkable satellite images from NASA’s Aqua and Terra polar-orbiting satellites show the pumice raft, as it drifts away from the volcano on the ocean current, stretching to tens of kilometres in length. It is also possible to see the underwater remnants of the eruption, revealed as a lighter blue patch in the ocean. The uninhabited volcanic Late Island is in the bottom right of these images; a reminder of the long history of tectonic activity in the area.
Credits: Images: NASA Terra and Aqua
July 2019 - Von Kármán vortex streets off the Canary islands
18 July 2019
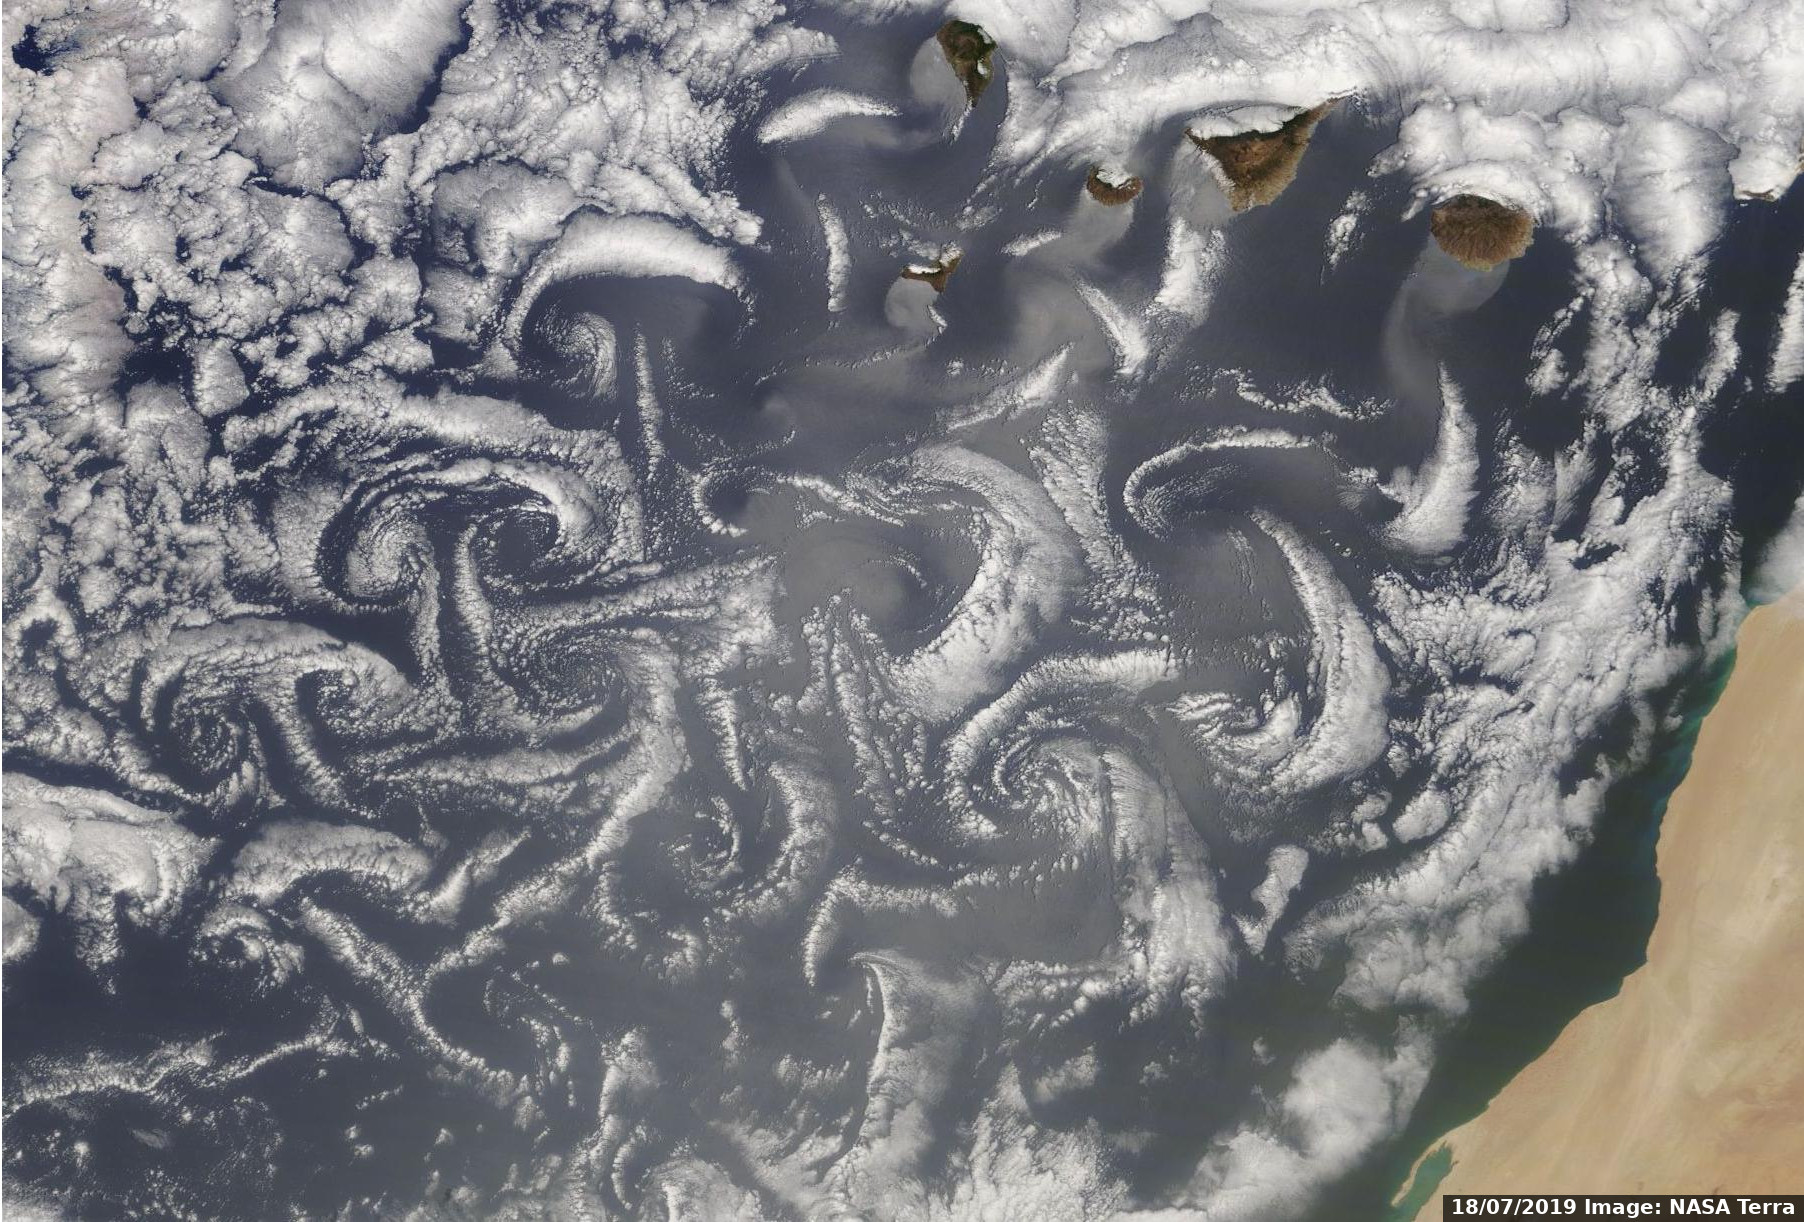
These atmospheric vortices are forming in the wake of the Canary Islands in the North Atlantic. This process, known as vortex shedding, happens when a fluid flows past a blunt object at a certain velocity. The interaction of the air and the object forms a ‘street’ of alternating low pressure vortices downstream of the object. In this case the fluid is air and the blunt objects are the Canary islands. As a cloud layer is present in the atmosphere, the vortices become visible from space. This image from 18 July shows several vortex streets lined up behind the Canary islands. It was captured by the Moderate Resolution Imaging Spectroradiometer (MODIS) aboard NASA’s Terra satellite, in a polar orbit at 705 km above the Earth’s surface. Incredibly this satellite has been in space observing the Earth for 20 years, providing a wealth of information about our changing planet.
Credits: Image: NASA Terra
June 2019 - Early morning radiation fog
28 June 2019
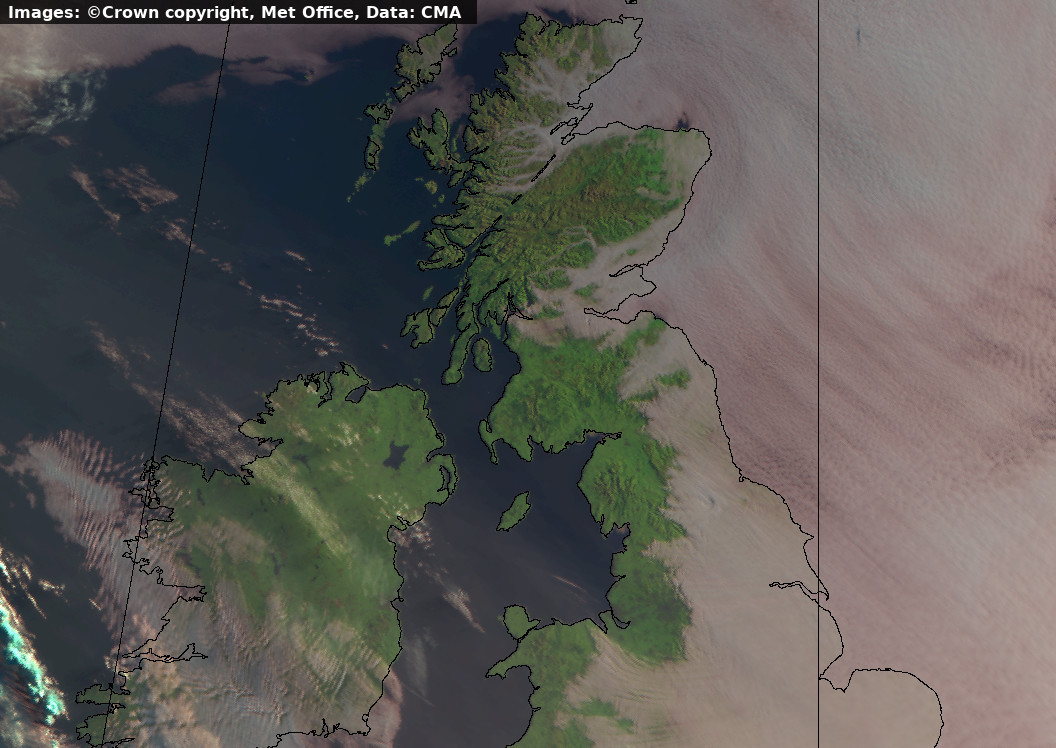
In this image from a polar-orbiting weather satellite in the Chinese FY3-series, the heat of the sun has yet to evaporate the early morning fog that clings to the Eastern side of the UK. This is one of a small number of polar-orbiting weather satellites to pass over early in the morning, imaging the UK at a time when the sun has only just risen and this scene was captured at 05:07 UTC on the morning of 28 June. The fog still lingers in the valleys of Scotland giving fractal like patterns and there is a wider coverage of fog or low cloud further south over Eastern England and across the Midlands. Rising and sinking air in the atmosphere, caused by air being forced away then returning to a level of neutral buoyancy, forms ripples like those in a pond These are known as gravity waves and can be seen here as ripples in the low cloud. The fog evaporated rapidly and was gone by mid-morning so that the UK went on to experience an almost completely cloud-free day.
Credits: Images: © Crown copyright, Met Office, Data: CMA
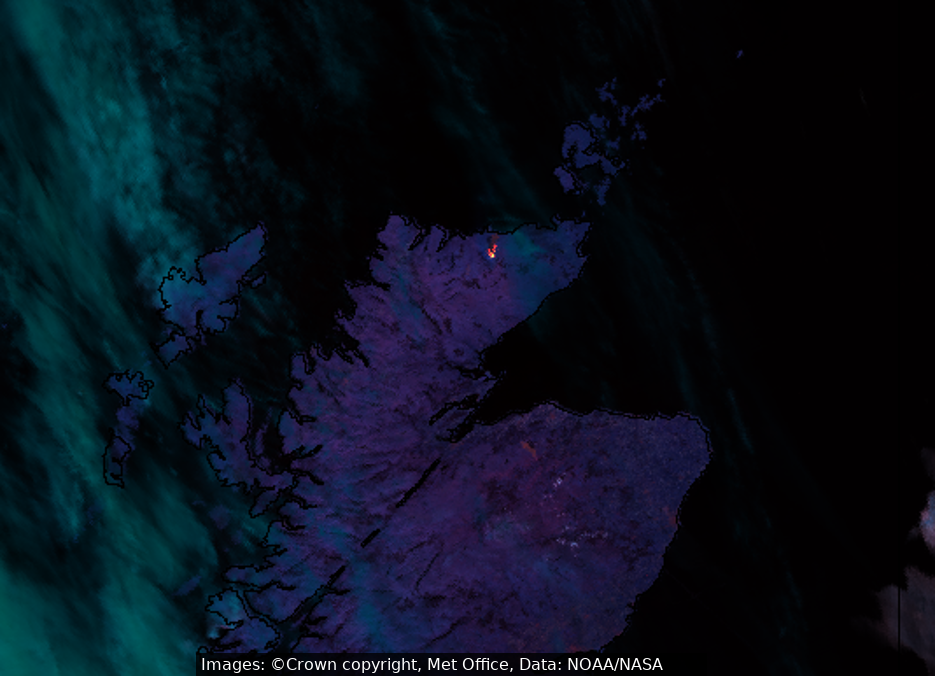
May 2019 - Scottish Wildfire in Sutherland
12 to 16 May 2019
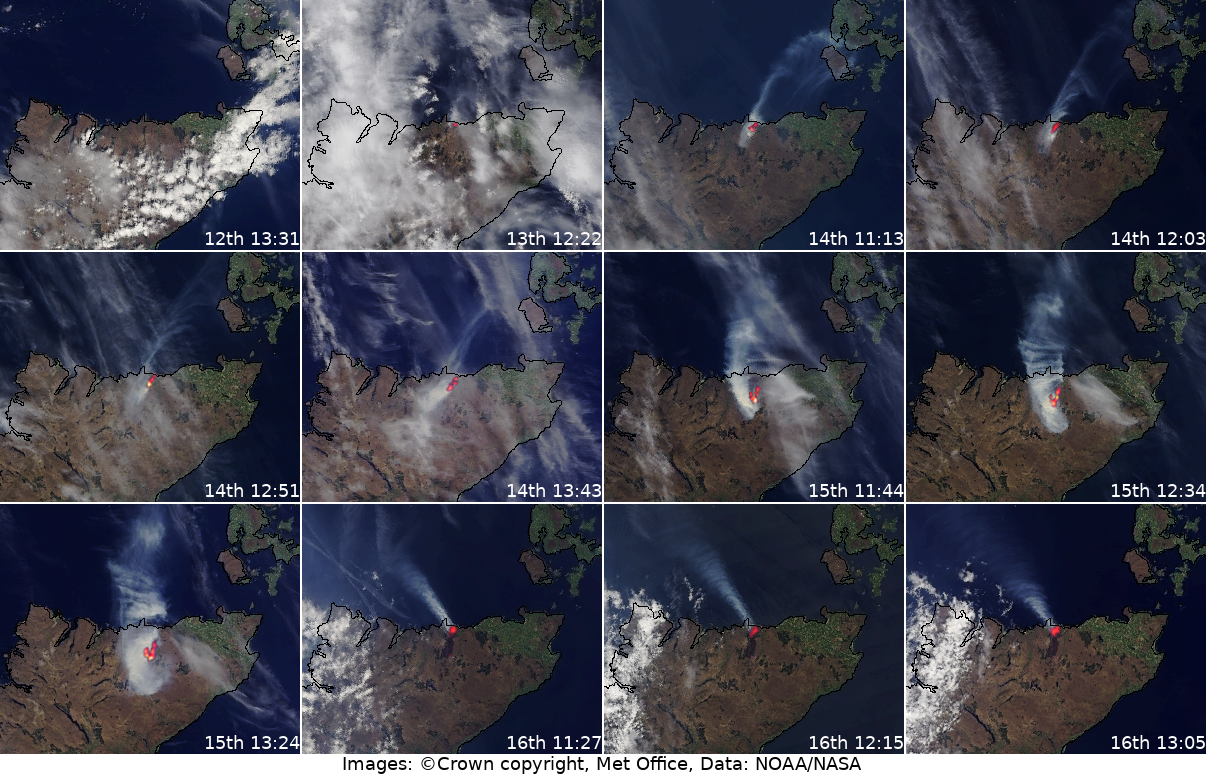
In mid-May a large wildfire consumed vast areas of moorland in the far North of the Scottish mainland. The fire burned for over 5 days, threatening homes and a nature reserve. The sequence of images above shows how the fire developed and moved.
Met Office scientists produce these images using data from the VIIRS imager on NOAA/NASA polar orbiting satellites. By using measurements of the Earth’s short-wave infrared emissions it is possible for us to detect areas of anomalously high surface temperature, which could be a tell-tale sign of wildfires. This creates an image like the one below. In these 'Fire temperature' images smaller, cooler fires appear red, while hotter fires appear orange, then yellow, with only the most intensely hot fires appearing white. These bright pixels stand out clearly from the purple background allowing fires to be easily identified and tracked.
True-colour images from the same satellite instruments show the land surface and smoke plume in these cloud-free conditions. If we isolate the fire pixels from Fire temperature images and overlay them on the true colour images then we can get a sequence of images as shown above.
Using the images it is possible to see how the fire spreads inland and intensifies over the 14th and 15th May, fanned by a sea breeze, which also blows the smoke inland. Winds at higher levels then capture the smoke plume and blow it back out towards the sea. By the 16th May the spread of the fire has halted, possibly due to increased winds aloft making conditions unfavourable for sea breeze formation. This, combined with the action of firefighters, led to the fire reducing in intensity before eventually being extinguished. The burn scar on the ground can be seen as a darker brown patch in the final three images of the sequence.
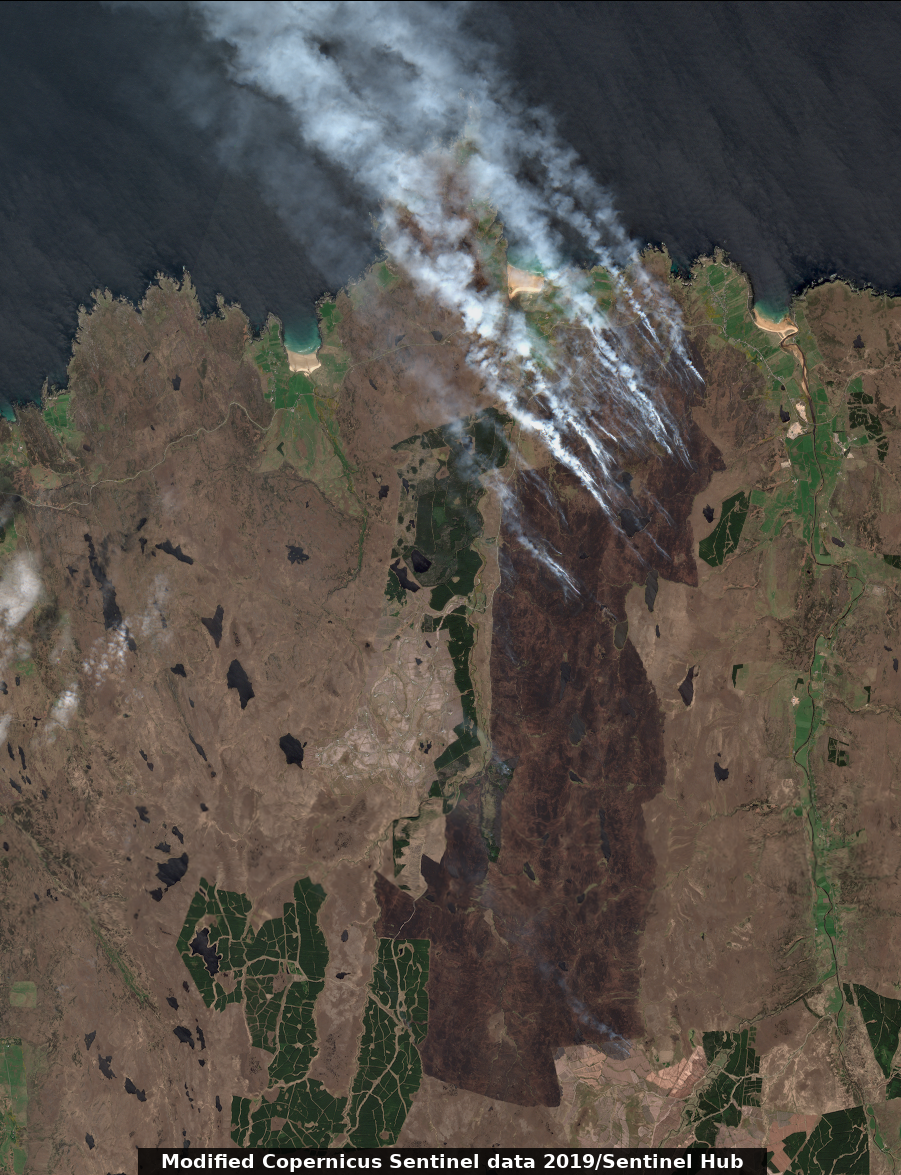
An overpass of the Copernicus Sentinel 2B satellite, operated by the European Space Agency, coincided with the tail-end of the fire, and the true-colour image below shows the smouldering ground and burn scar in very high detail.
Credits: Top Image panel and second image: © Crown copyright, Met Office, Data: NOAA/NASA
Bottom image: Modified Copernicus Sentinel data, 2019, processed by Sentinel Hub.
April 2019 - A low-light night-time view over parts of Europe, without and with moonlight.
10 & 19 April 2019
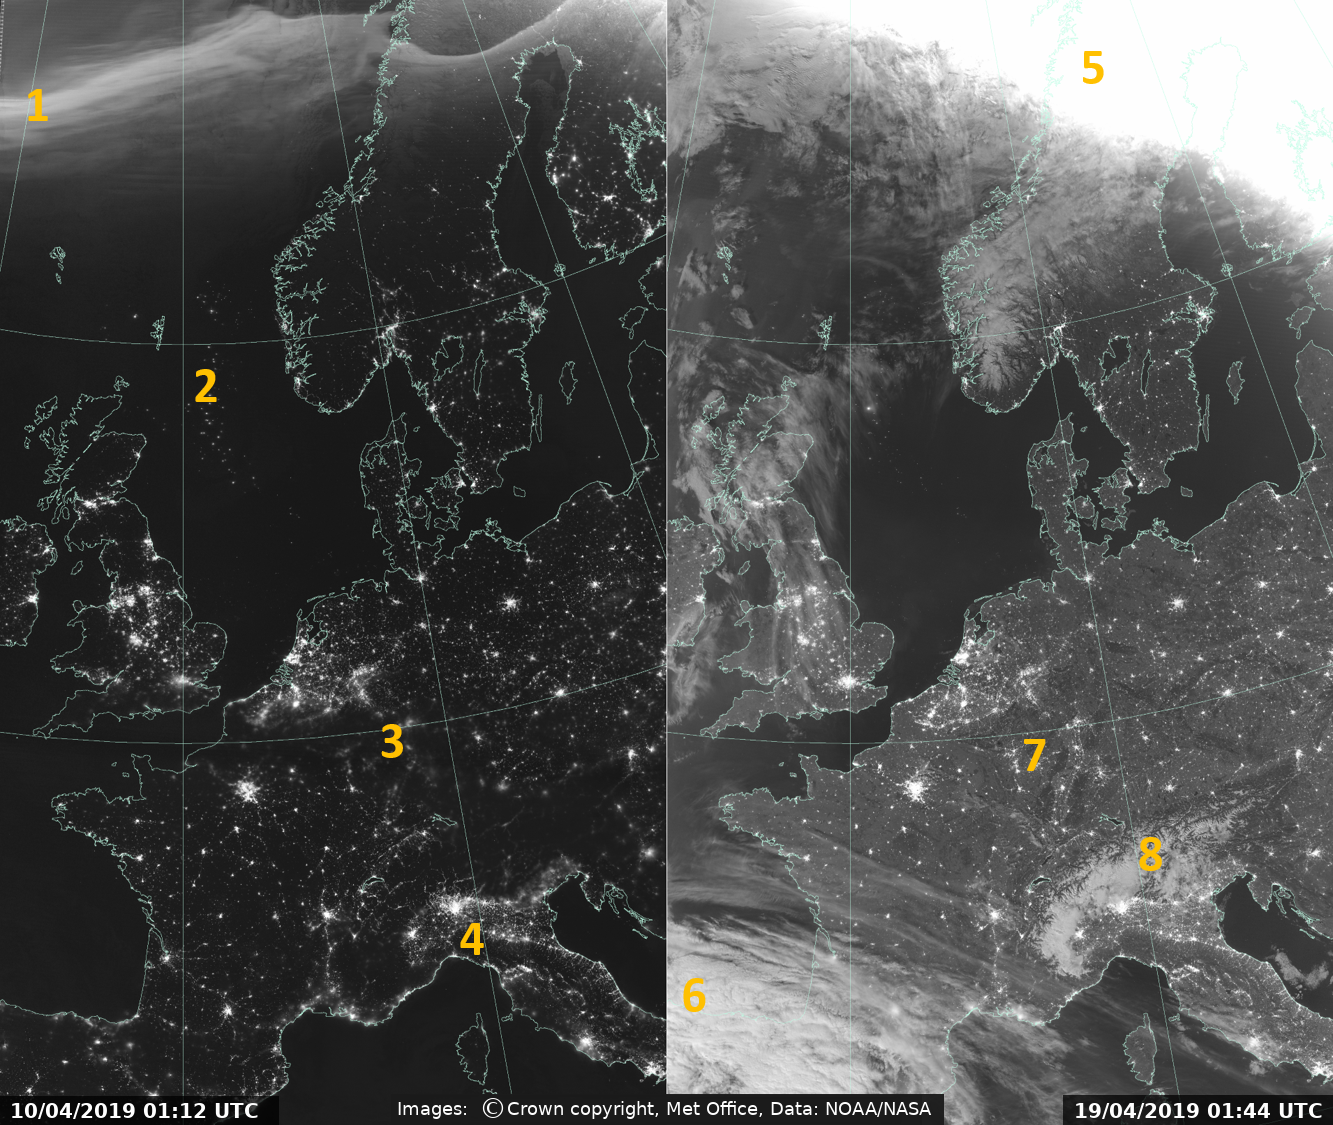
The Visible Infra-red Imaging Radiometer Suite (VIIRS) is an instrument carried by recent NOAA/NASA polar-orbiting weather satellites. VIIRS is capable of capturing incredible night-time scenes on a channel that can detect extremely low levels of visible (and near infra-red) light. This channel is known as the day/night band (DNB). The features you can see in a DNB image depend on the phase of the moon, as demonstrated by these two images from different nights in April.
The image on the left is from the night of 10th April at shortly after 01:00 UTC. There is no lunar illumination as the waxing crescent moon has already set by this time. Without moonlight clouds are not seen clearly, however other sources of light stand out clearly. Some of the key features you can see with no moonlight include:
- The Aurora Borealis. This band of light running across the top of the image is the Northern Lights;
- Oil platforms and ships in the North Sea and The English Channel;
- Urban lights that are beneath cloud. These appear blurred;
- Urban lights in clear skies. These are sharp and bright. Illuminated roads can be clearly seen, such as the E35 and A14 in Northern Italy, running from Milan to the Adriatic Coast.
The image on the right is taken on the night of the full moon, 19th April, shortly before 02:00 UTC. Here the light reflected by the moon illuminates the whole scene, and in this low-light imagery clouds and the Earth's surface appear as if in daylight. Some of the key features you can see with moonlight include:
- Bright, washed out area caused by sunlight as the sun rises in the East;
- Cloud. Looking very much as it does in a daytime visible image - useful for forecasters who can't normally see this multi-layered, textured cloud detail in thermal infrared satellite imagery at night;
- Urban lights and illuminated roads;
- Surface detail, illuminated by moonlight. Snow-capped mountains, such as the Alps stand out clearly.
Credits: Images: © Crown copyright, Met Office, Data: NOAA/NASA
March 2019 - Cyclone Idai - Mozambique Flooding
14 March 2019
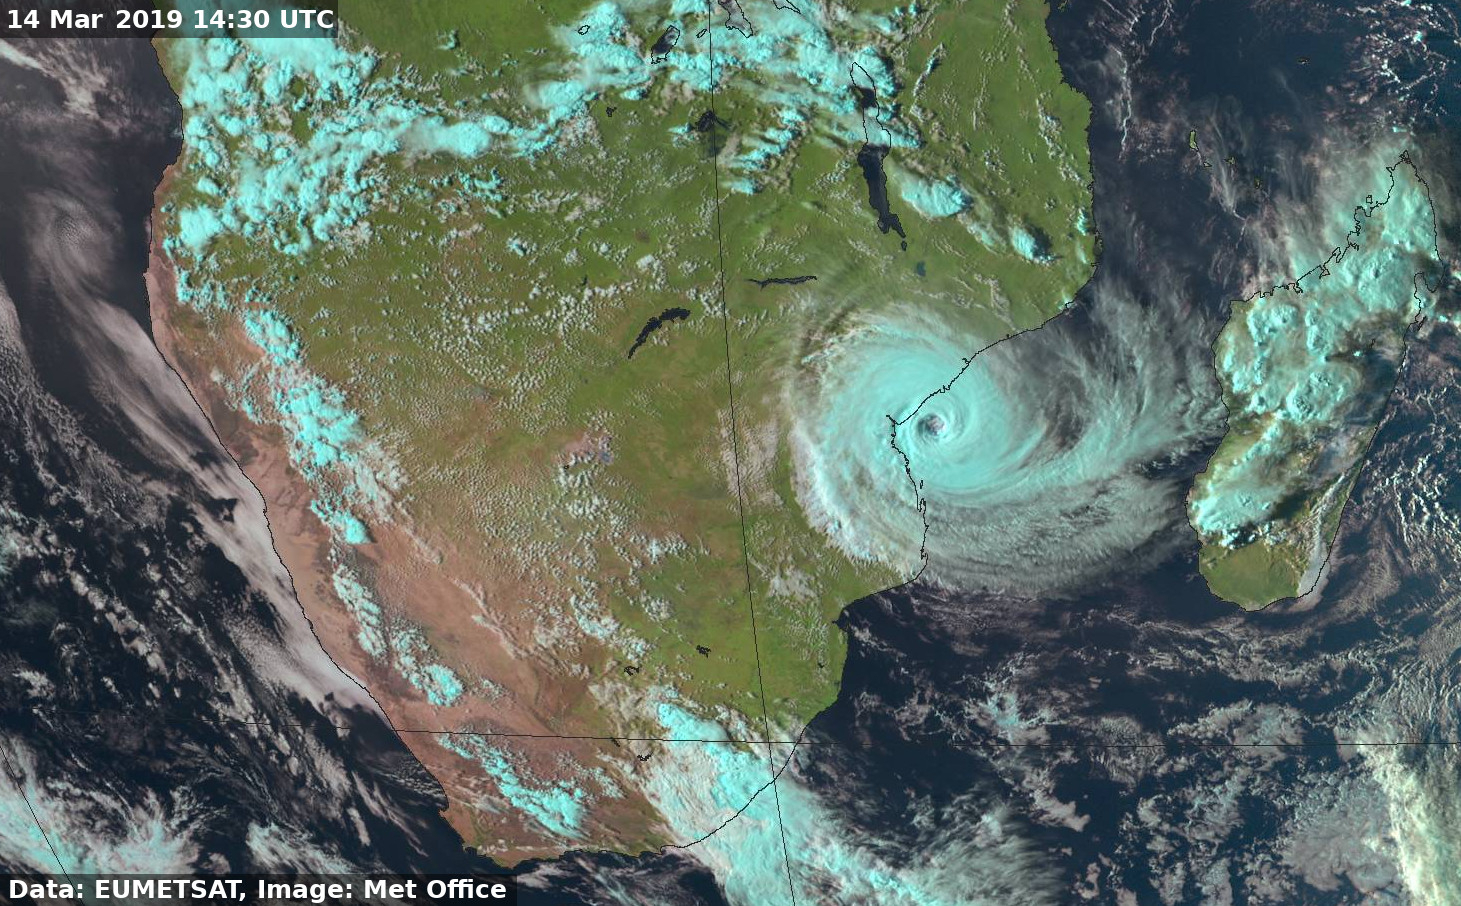
In March a powerful Tropical Cyclone affected parts of Southern Africa, including Madagascar, Mozambique, Malawi, and Zimbabwe. The storm was long lived and led to widespread damage, flooding and a Humanitarian crisis in the countries where it made landfall. The false colour image above shows the storm at peak intensity, shortly before making a second landfall in Mozambique. The image is created from visible and near Infra-red channels of the Spinning Enhanced Visible and Infrared Imager (SEVIRI) instrument above from Meteosat-8, a geostationary satellite operated by EUMETSAT providing coverage of the Indian Ocean area. The cyclone tracked to the North of the Mozambique city of Beira causing widespread flooding in the region. The images below are from two NASA polar-orbiting satellites, TERRA and AQUA. These are true-colour images taken in relatively cloud free conditions both before (top image) and 10 days after (bottom image) the cyclone tracked over the area. The extent of the brown floodwaters are clearly visible in the bottom image.
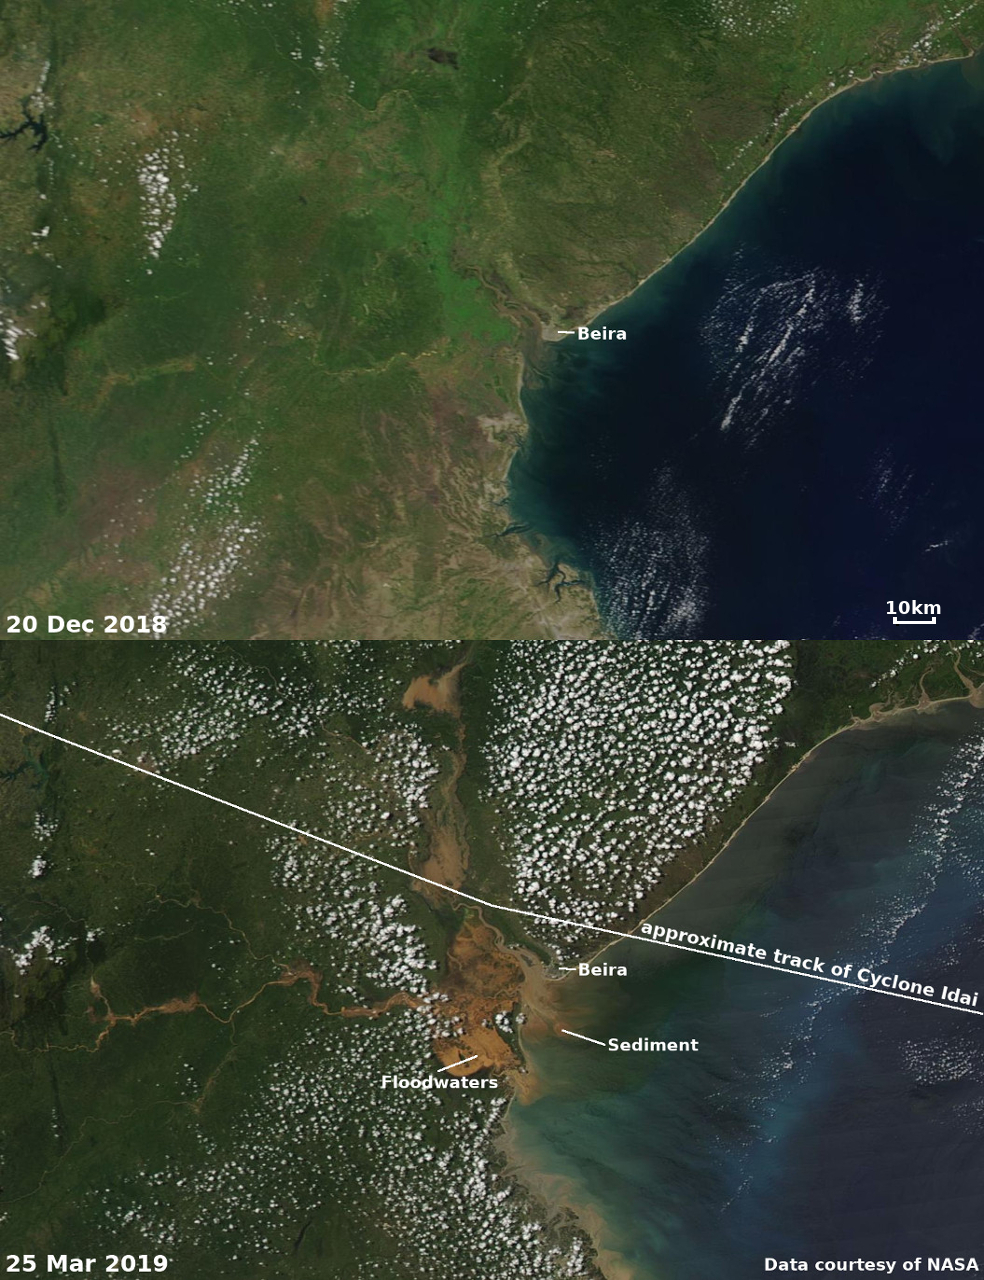
Credits: First image: © Crown copyright, Met Office, Data: EUMETSAT. Lower images: Courtesy of NASA
February 2019 - Super Typhoon Wutip
25 February 2019
Typhoon Wutip formed in the Pacific near Micronesia in February, rapidly intensifying to become a Category 5-equivalent Super Typhoon on the 25th February. On this date Wutip had peak 1-minute sustained wind-speeds of 260 km/h, making it the strongest recorded February tropical cyclone anywhere north of the equator and the strongest February Typhoon in the Western Pacific Ocean.
This is a true-colour image combining three channels from the Visible Infrared Imaging Radiometer Suite (VIIRS) on-board the NOAA & NASA operated Suomi-NPP satellite. This is a polar-orbiting satellite that orbits the earth every 101 minutes at an altitude of around 830 km.
Credits: Image: © Crown copyright, Met Office, Data: NOAA/NASA
January 2019 - A view of the surface from Space over snow covered Alps and Northern Italy
25 January 2019
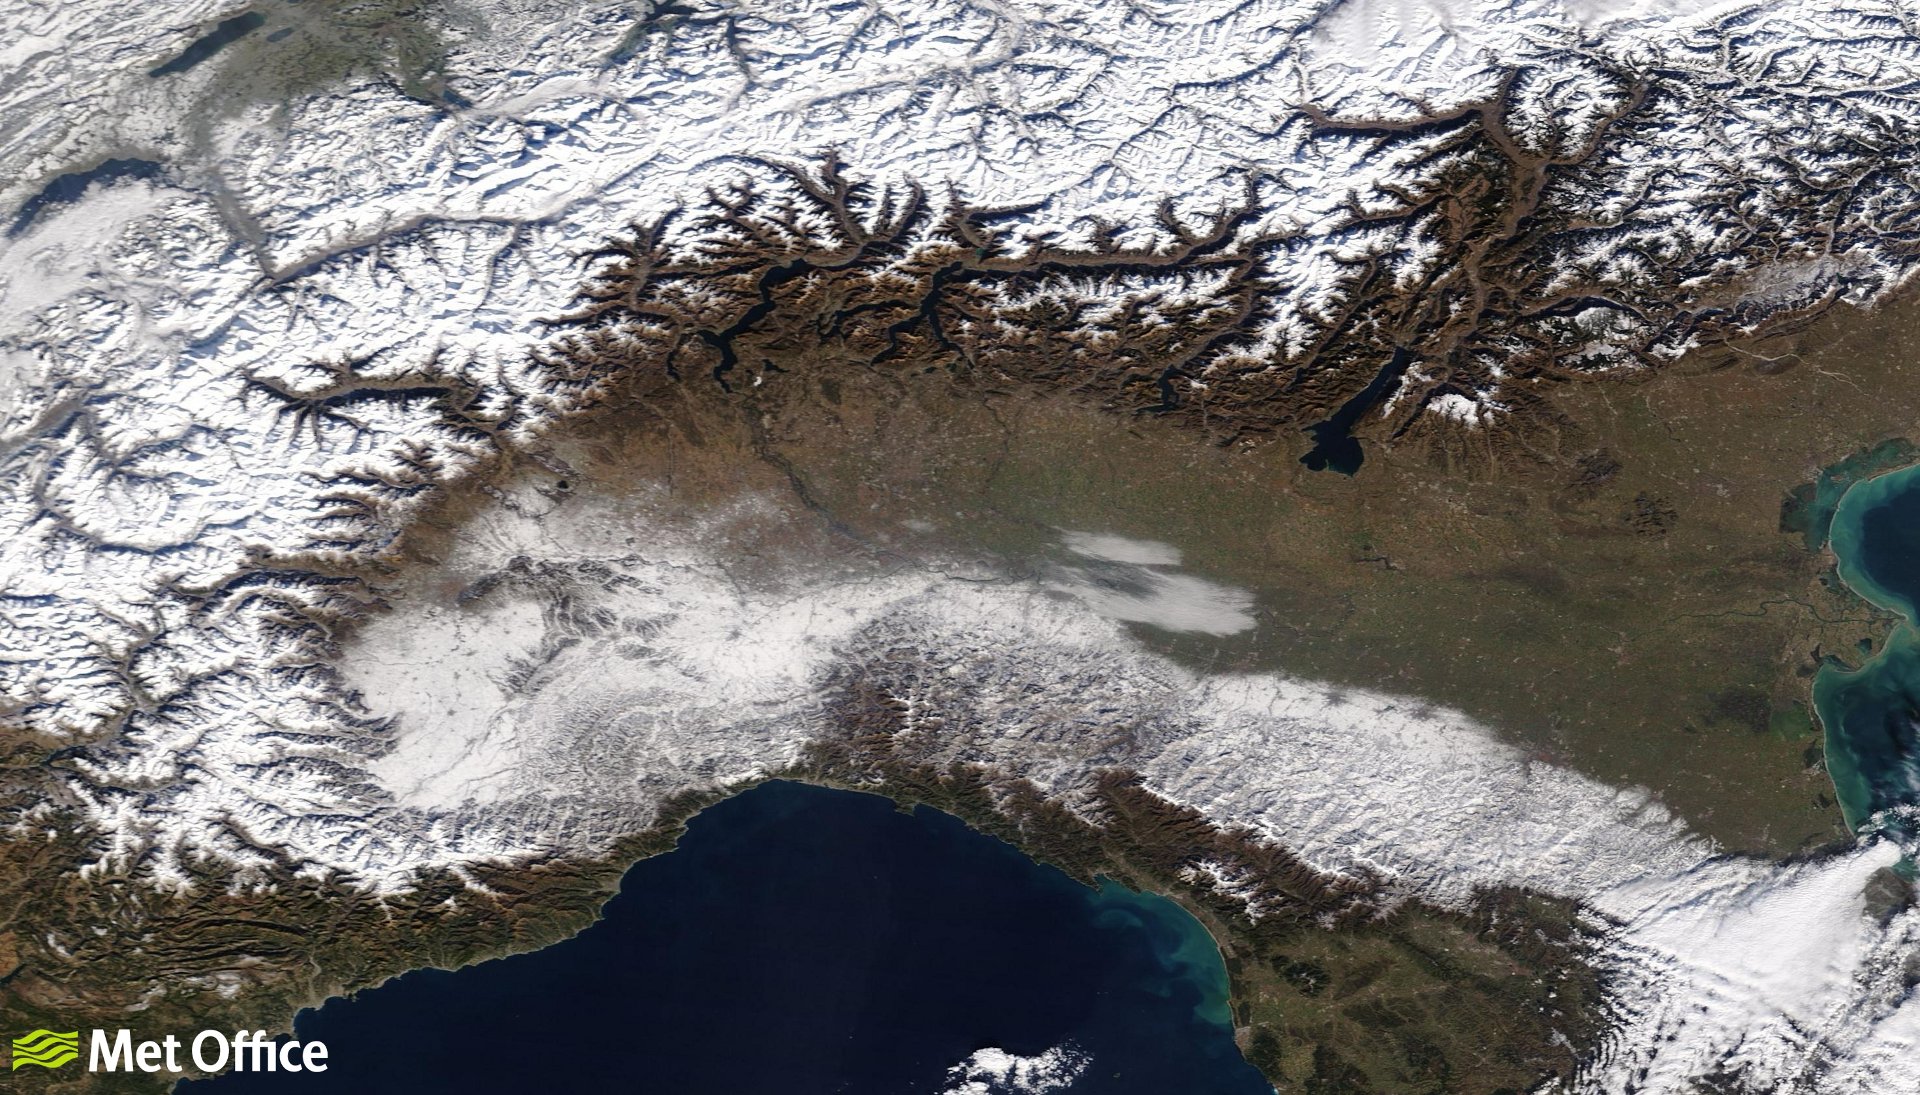
The snow on the Alps combined with the snow-free valleys produce a fractal-type pattern around the edges of the mountain range when seen from Space in this largely cloud-free image captured by the Moderate-resolution Imaging Spectroradiometer (MODIS) on NASA's Terra satellite. A wide band of snow has fallen over Northern Italy, leaving a white streak between the Alps in the West of Italy over Turin and towards San Marino. This instrument measures incoming radiation from the Earth and it's atmosphere as it orbits 710 km above the surface of the Earth. Each orbit takes 99 minutes to complete. If we combine the measurements from three visible wavelengths, corresponding to red light, green light and blue light, we can create a 'true colour' image which looks like a photograph.
Credits: Image: © Crown copyright, Met Office, Data: NASA