UK experiences coolest summer since 2015
Author: Press Office
11:37 (UTC+1) on Mon 2 Sep 2024
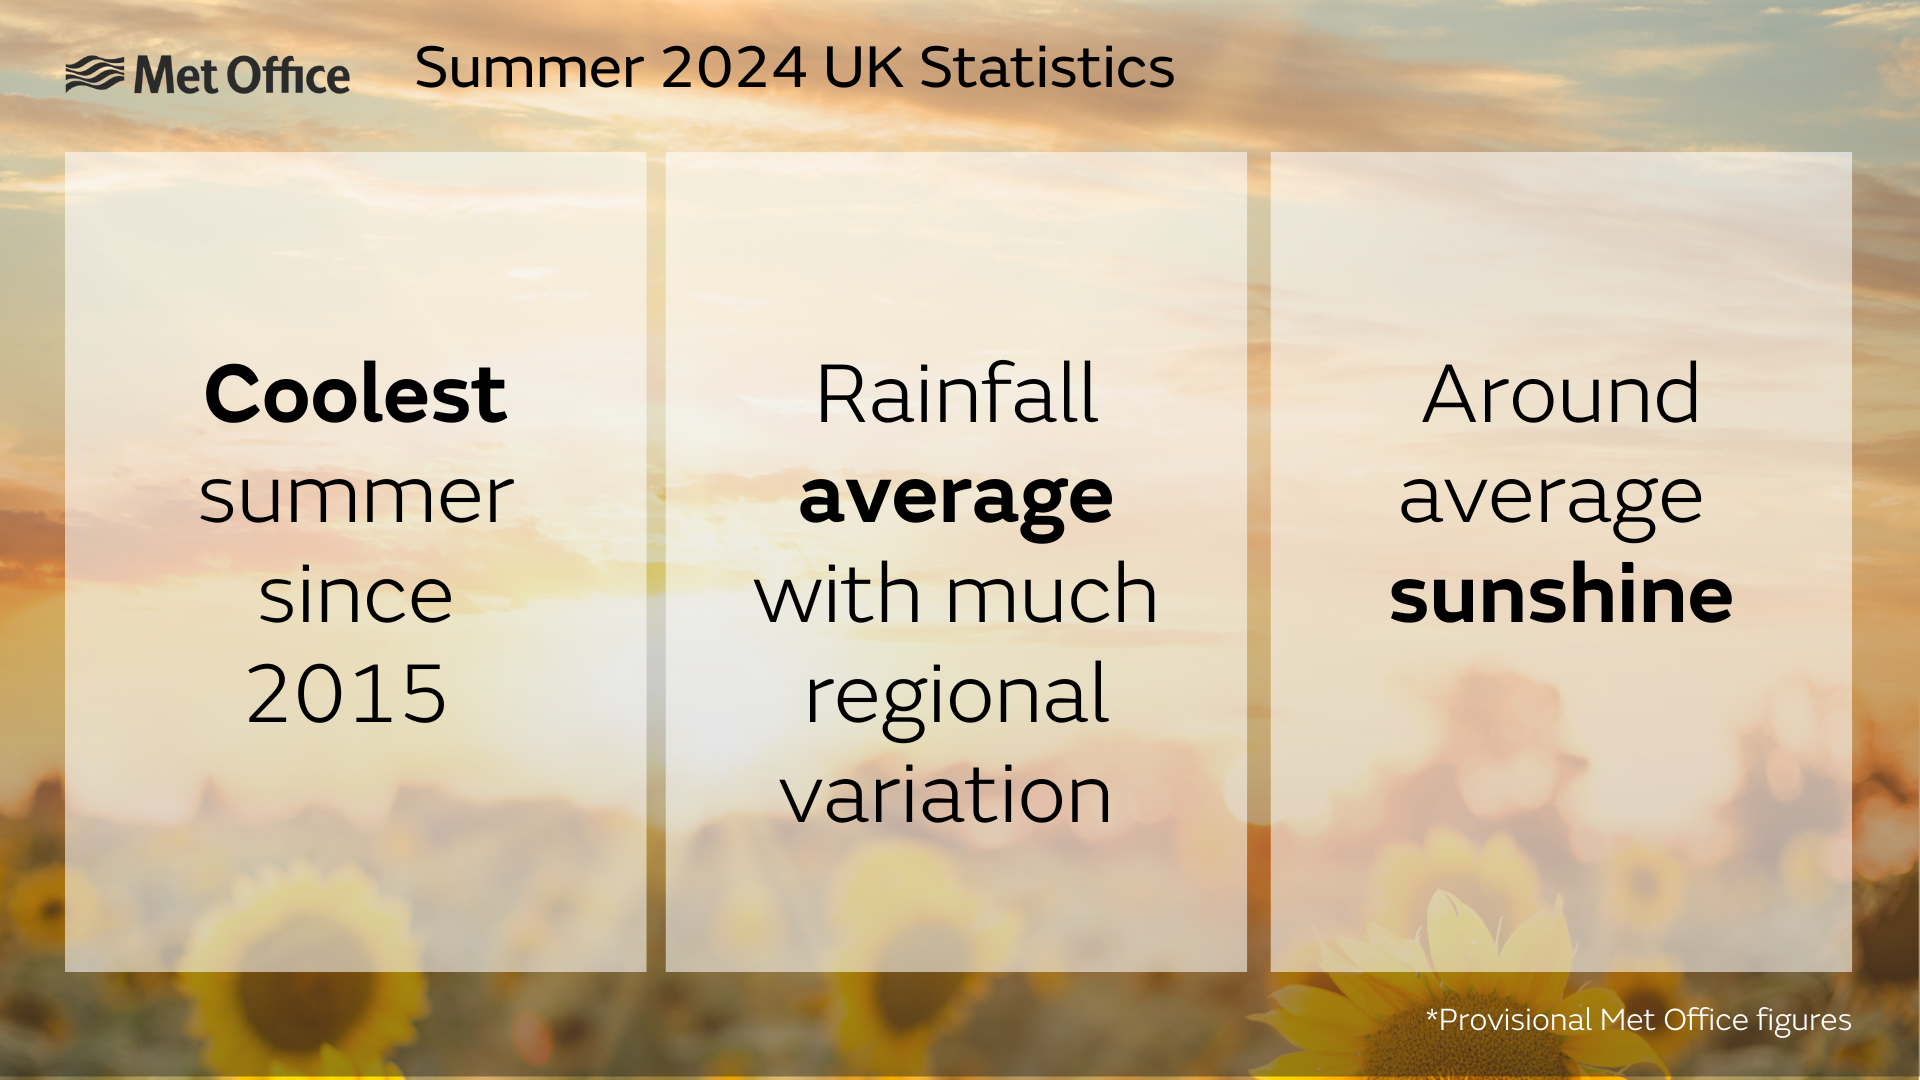
The UK has had its coolest summer since 2015, according to provisional Met Office statistics.
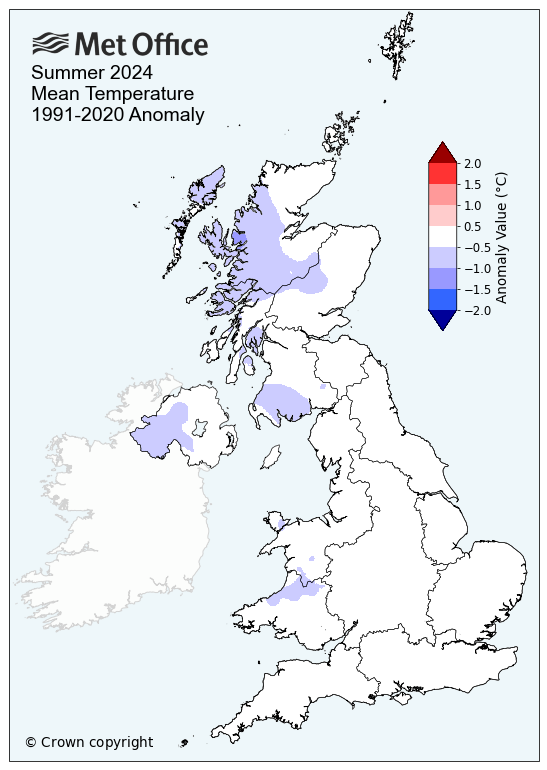
Mean temperatures have been 0.22°C below the long-term meteorological average for the UK, with Scotland and Northern Ireland experiencing generally cooler temperatures.
Rainfall rates for the UK were around average, but with some substantial regional variation.
Summer 2024 also saw Storm Lilian named on the 22 August. Lilian was the 12th storm to be named this storm season, and is the furthest through the list the Western European naming group has got since storm naming was introduced in 2015.
Met Office Scientist Emily Carlisle explained: “I don’t think it will surprise anyone that this summer has been cooler than average for the UK. Mean temperatures in both June and July were below average, with temperatures in August only slightly above. This was largely due to northerly winds bringing cold Arctic air to the UK in June and July, while August saw an increase in westerly winds bringing slightly warmer Atlantic air.
“Although we had some heatwaves and bursts of hot weather, these were fairly short-lived and conditions across the whole three months were pretty unsettled. August was the wettest month of the summer, with some places in Scotland experiencing double their average summer rainfall during the month and Storm Lilian bringing strong winds and heavy rain at the end.”
Cooler than average temperatures
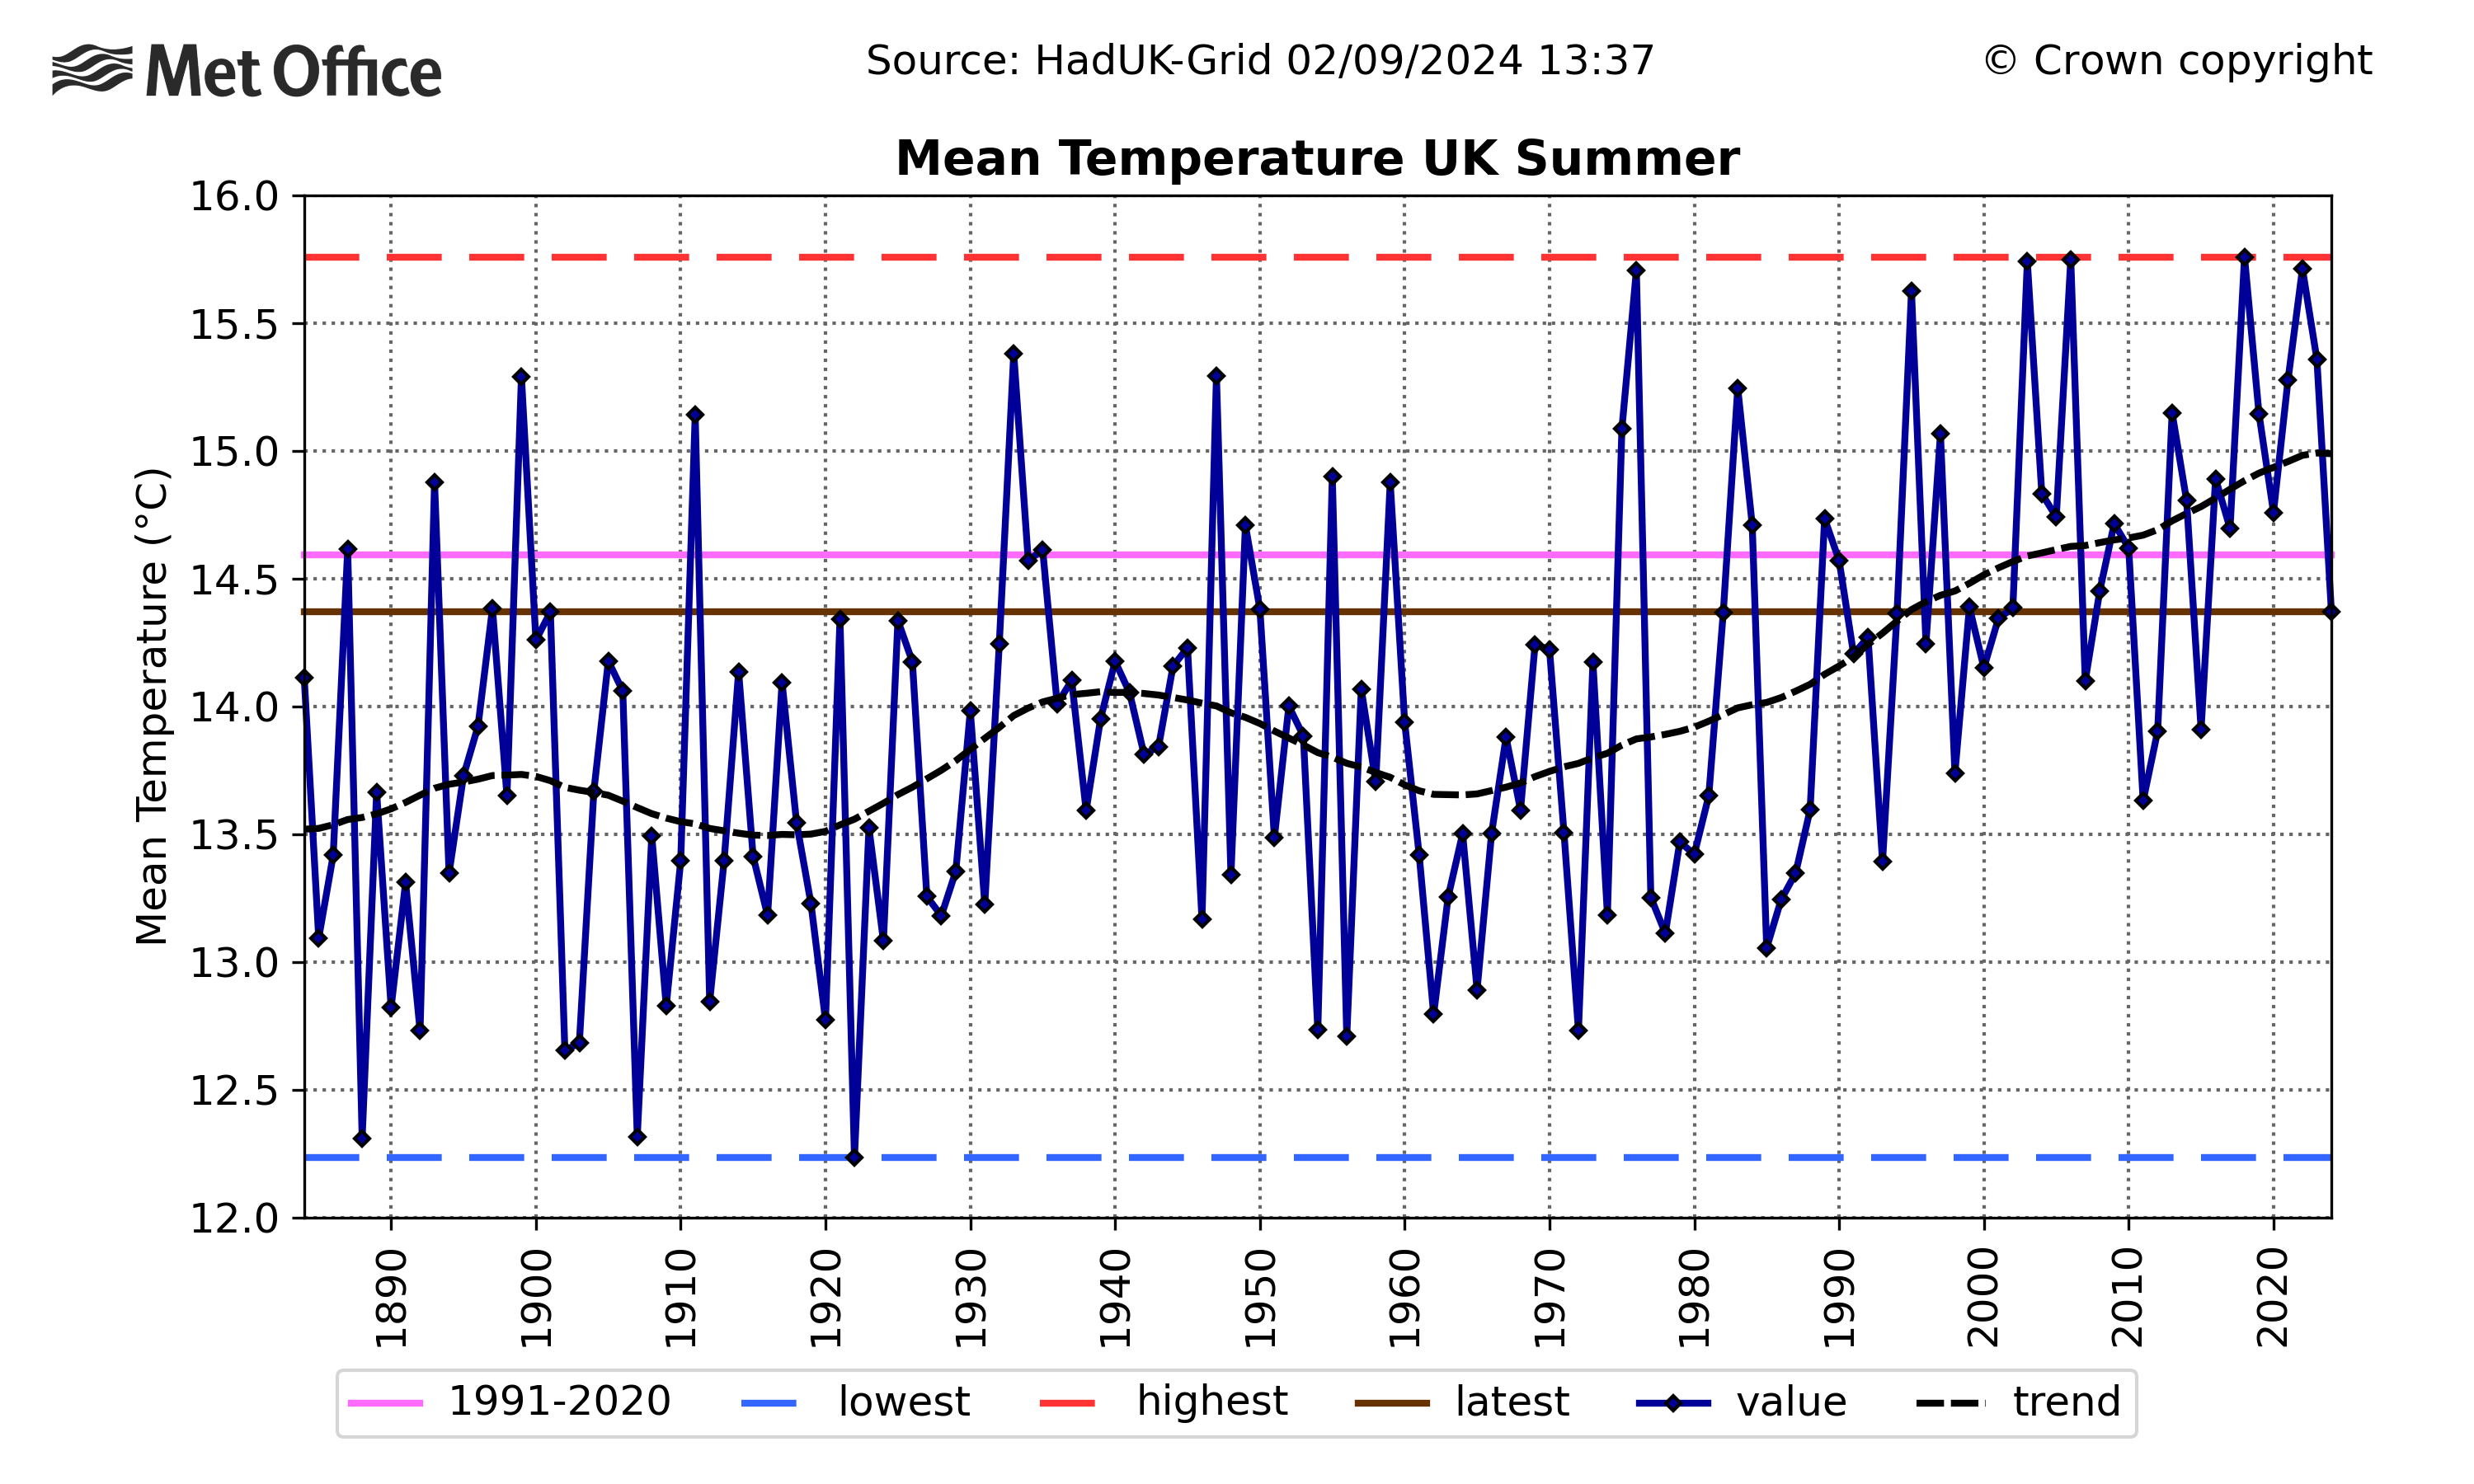
The average mean temperature for the UK was 14.37°C, which is 0.22°C cooler than the long-term meteorological average. The last time the mean temperature was this low was in 2015, when the summer’s average was 13.91°C.
There was some regional variation though, with England only 0.07°C below average while Scotland and Northern Ireland were 0.40°C and 0.45°C below average, respectively. Occasional warm spells brought individual daytime temperatures near 30°C in many areas of the south, but northern areas were generally cooler. Cambridge saw the highest temperature of the year so far on 12 August with 34.8°C recorded.
Summer in a changing climate
Summer 2024’s average mean temperature of 14.37°C for the UK is considered ‘cooler’ when compared to the 1991-2020 current meteorological average of 14.59°C. But interestingly, 14.37°C would be considered ‘warmer’ than average if compared to the 1961-1990 meteorological averaging period, where the average mean temperature was 13.78°C.
Emily Carlisle explained: “While this summer may have felt cool compared to recent years, it’s important to note where it sits in a historical context, with the changing climate of the UK increasing the frequency of warmer summers, as can be observed through our observations. While climate change increases the frequency of warmer weather in the UK, our natural variability means that we’ll still experience cooler than average summers at times.”
The below graph shows UK summer mean temperature from 1884 to present. The graph shows the year-to-year variability of UK summer temperatures, but a generally warming trend.
Around average rainfall
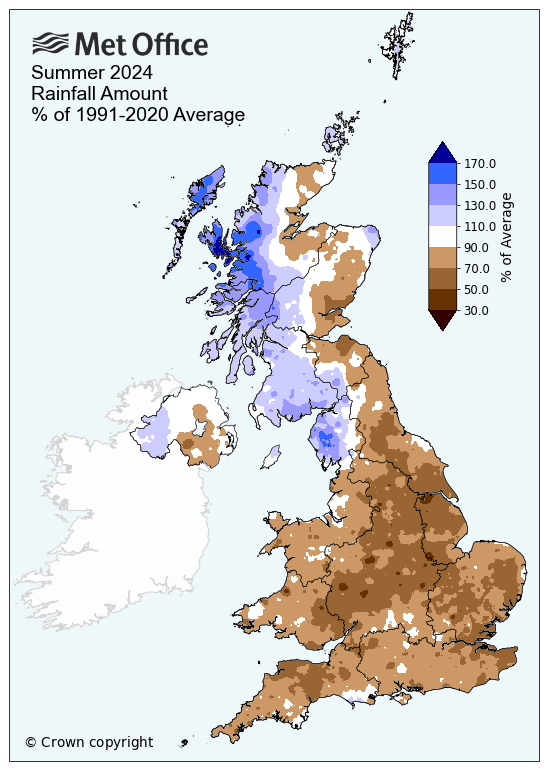
Summer 2024 saw around average rainfall for the UK, with 241.3mm meaning 5% less than average. However, there was substantial regional variation, with Scotland particularly wet and England particularly dry.
Neither were enough to nudge any seasonal records though, with Scotland experiencing 373.8mm of rainfall – 18% more than its average. England on the other hand, saw 159.4mm, 23% less than its seasonal average.
Around average sunshine
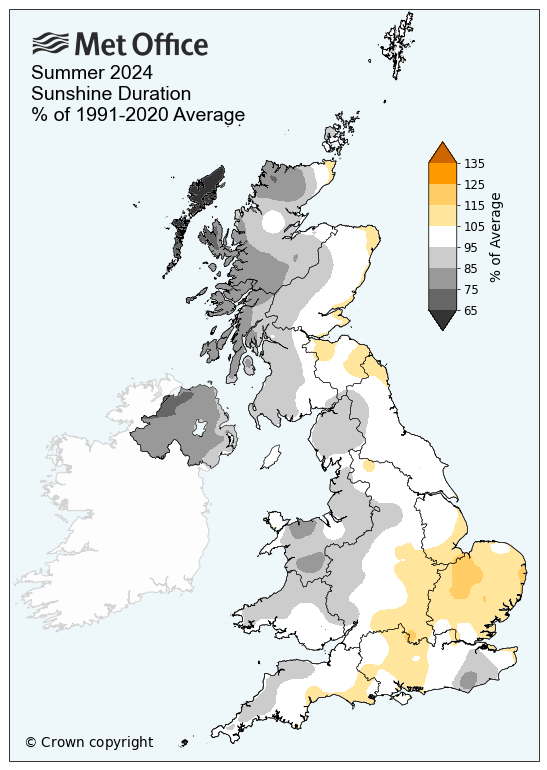
This summer saw around average hours of sunshine, with 491.6 hours provisionally recorded in the UK, 97% of the long-term average. Southern England was marginally sunnier than Wales and Scotland, and Northern Ireland experienced the least sunshine at only 82% of its long-term average.
Provisional Summer 2024 statistics
| Maximum temp | Minimum temp | Mean temp | Rainfall | Sunshine | ||||||
|---|---|---|---|---|---|---|---|---|---|---|
| Area | Actual temp (°C) | Anomaly (°c) | Actual temp (°C) | Anomaly (°C) | Actual temp (°C) | Anomaly (°C) | Actual (mm) | Anomaly (%) | Actual (hours) | Anomaly (%) |
| UK | 18.60 | -0.27 | 10.20 | -0.17 | 14.37 | -0.22 | 241.3 | 95 | 491.6 | 97 |
| England | 20.34 | -0.02 | 11.01 | -0.12 | 15.66 | -0.07 | 159.4 | 77 | 573.3 | 101 |
| Wales | 18.19 | -0.50 | 10.39 | -0.23 | 14.25 | -0.38 | 240.3 | 79 | 476.2 | 92 |
| Scotland | 16.04 | -0.59 | 8.87 | -0.20 | 12.38 | -0.40 | 373.8 | 118 | 384.5 | 91 |
|
N. Ireland |
17.44 | -0.59 | 9.82 | -0.32 | 13.61 | -0.45 | 266.2 | 99 | 344.3 | 82 |
A slightly warmer August
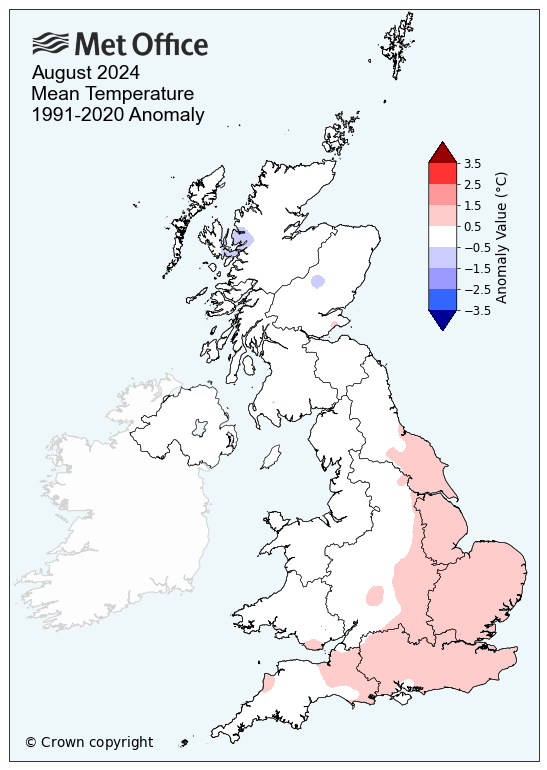
After below average temperatures for June and July, August 2024 brought slightly above average temperatures for the UK. The August mean temperature was 15.4°C, which is 0.3°C above the long-term average.
There was regional variation though, with Scotland and Northern Ireland slightly below average (both -0.1°C) and England more above average (0.6°C). The southeast experienced the most frequent warm weather.
Average rainfall but wet for some
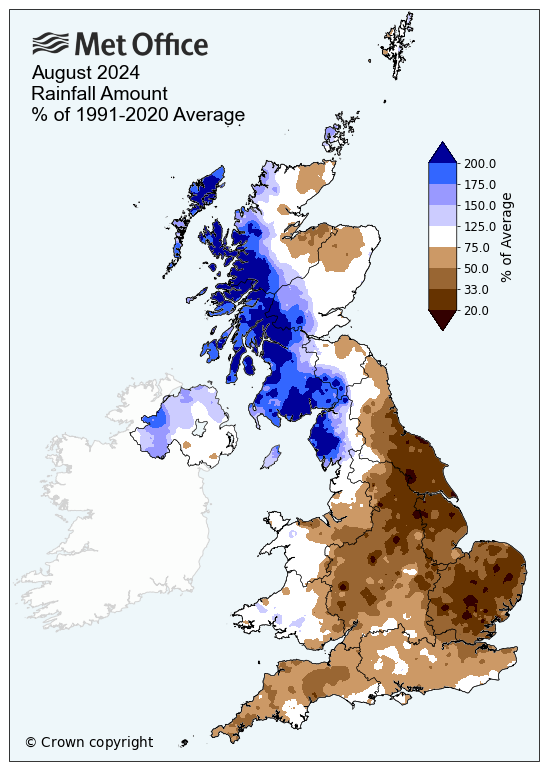
Rainfall for the UK was around 10% above average, with 103.5mm but, as with the temperatures, there was much regional variation.
Scotland provisionally experienced over one-and-a-half times its average August rainfall (162%), while southern England only recorded half of its monthly average (50%). Some areas of Scotland including Glasgow, Renfrewshire, and Ayrshire and Arran provisionally recorded over double the average August rainfall.
A dull August for many
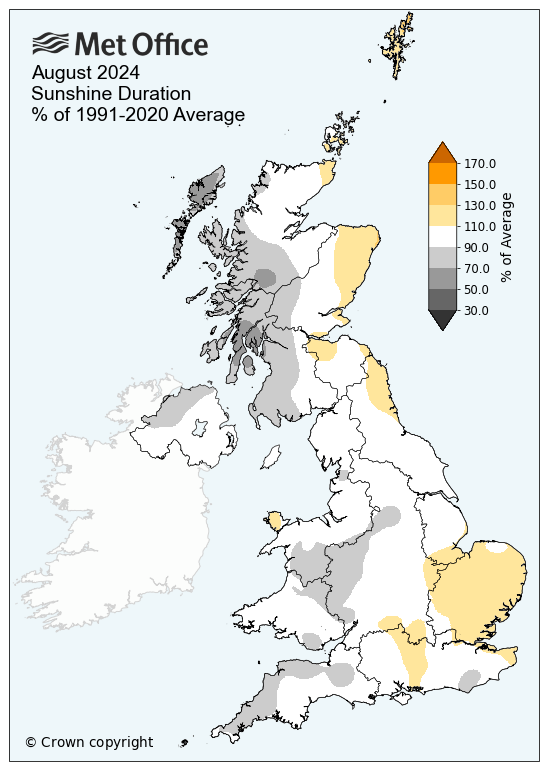
Sunshine was just slightly below average for the UK, with 159.6 hours provisionally recorded, which is 99% of the long-term average.
Provisional August 2024 statistics
| Maximum temp | Minimum temp | Mean temp | Rainfall | Sunshine | ||||||
|---|---|---|---|---|---|---|---|---|---|---|
| Area | Actual temp (°C) | Anomaly (°c) | Actual temp (°C) | Anomaly (°C) | Actual temp (°C) | Anomaly (°C) | Actual (mm) | Anomaly (%) | Actual (hours) | Anomaly (%) |
| UK | 19.5 | 0.2 | 11.3 | 0.3 | 15.4 | 0.3 | 103.5 | 110 | 159.6 | 99 |
| England | 21.5 | 0.6 | 12.3 | 0.5 | 16.9 | 0.6 | 46.2 | 62 | 184.6 | 102 |
| Wales | 18.9 | -0.1 | 11.8 | 0.6 | 15.3 | 0.2 | 103.5 | 93 | 150.6 | 94 |
| Scotland | 16.6 | -0.3 | 9.7 | 0.1 | 13.1 | -0.1 | 194.6 | 162 | 126.1 | 94 |
|
N. Ireland |
18.1 | -0.2 | 10.7 | 0.0 | 14.4 | -0.1 | 127.8 | 129 | 126.4 | 93 |


