Briefing on Arctic and Antarctic sea ice - June 2019
Alex West and Ed Blockley
Summary
- Arctic sea ice extent is currently fifth-lowest on record for the time of year. This reflects an abrupt slowing of melt in the past week following a period since late March in which sea ice was at record or near-record lows.
- These conditions reflect a recent switch to cool, cyclonic conditions in the Arctic following a record-warm May, and a very mild winter (albeit less mild than the preceding three winters). Winter 2018-2019 was less mild than the last three winters in the Arctic, but still much warmer than the 1981-2010 average.
- Evidence from satellite measurements and models suggests that sea ice thickness at the end of winter 2018-19 was higher than the previous year. However, it is likely that by the end of May ice thickness had fallen back to levels below that of the previous year.
- The extent of sea ice melt this coming summer remains highly dependent on Arctic weather conditions and cannot reliably be predicted at this point in the summer.
- Antarctic sea ice extent is also the lowest on record for the time of year.
Current Arctic sea ice extent
Arctic sea ice extent on 19th June 2019 was 10.48 million square km according to data from the US National Snow and Ice Data Center (NSIDC). This is the 5th lowest value for this date on record. It is 1.12 million square km below the 1981-2010 average, and 0.19 million square km above the record low for this date, which occurred in 2012. The current sea ice extent reflects an abrupt slowing of ice loss in the past week following over two months of record or near-record lows (Figure 1).
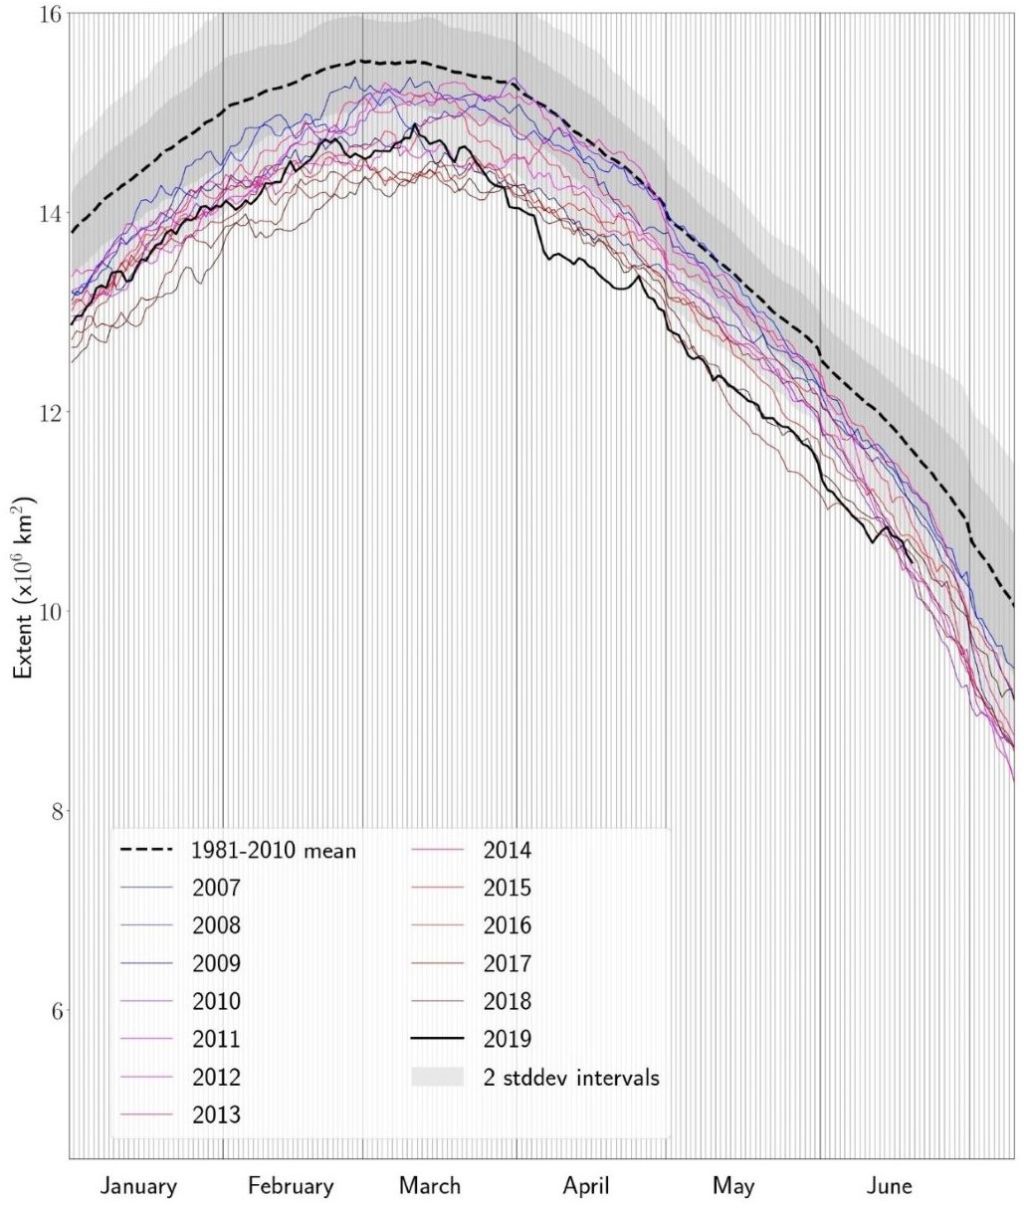
Figure 1. Daily Arctic sea ice extent for 2019, compared with recent years and the 1981-2010 average with ± 1 and 2 standard deviation intervals indicated by the shaded areas. Data are from the National Snow and Ice Data Center (NSIDC).
Extent was well below average in the Beaufort Sea, Chukchi Sea, and Barents Sea, where the ice edge had retreated much further north than the 1981-2010 average sea ice edge for the same date. It was also well below average in the Laptev and Kara seas, both of which saw extensive areas of open water east of the New Siberian Islands and north of the Gulf of Ob respectively. The East Siberian Sea was the only marginal sea of the Arctic Ocean in which sea ice retreat had not yet commenced.
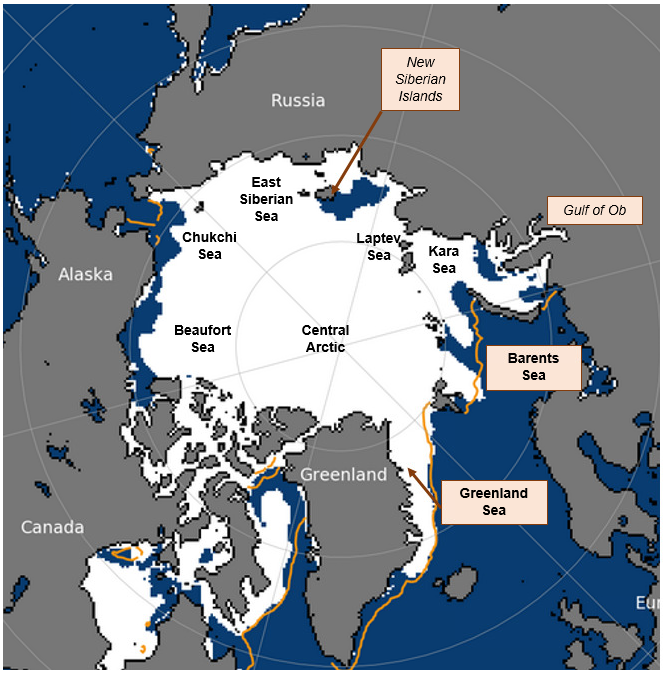
Figure 2. Arctic sea ice extent on 19th June 2019, with 1981-2010 average extent indicated in orange, and the regions referred to in the text labelled. Underlying map and data courtesy of NSIDC.
May 2019 in context
Average sea ice extent for the month of May 2019 was 12.24 million square km according to the HadISST1.2 dataset (Rayner et al., 2003), the second lowest on record after 11.90 million square km in 2016. This is 1.46 million square km below the 1981-2010 average, and 0.74 million square km below the long-term linear trend (Figure 3).
 Figure 3. Average May Arctic sea ice extent according to the Hadley Centre Sea Ice and Sea Surface Temperature (HadISST) 1.2 dataset (Rayner et al, 2003).
The average rate of sea ice loss during May was 49,000 square km per day, slightly higher than the 1981-2010 average of 47,000 square km per day. It is worth noting that surface temperature north of 70°N in May 2019 was the highest on record, as measured by the NCEP reanalysis.
Review of atmospheric drivers during winter and spring
Winter 2018-2019 was considerably less mild than the previous three winters over the Arctic Ocean (Figure 4). For each of the three winters from 2015-2016 to 2017-2018, average surface temperature north of 70°N from November-March was over 1°C higher than that of any previous winter. By contrast, in 2018-2019 surface temperature was comparable to that of winters in the 2005-2015 period, but still warmer than the 1981-2010 average.  Figure 4. Average November-March surface air temperature for the region north of 70°N from 1970-present, according to the NCEP reanalysis.
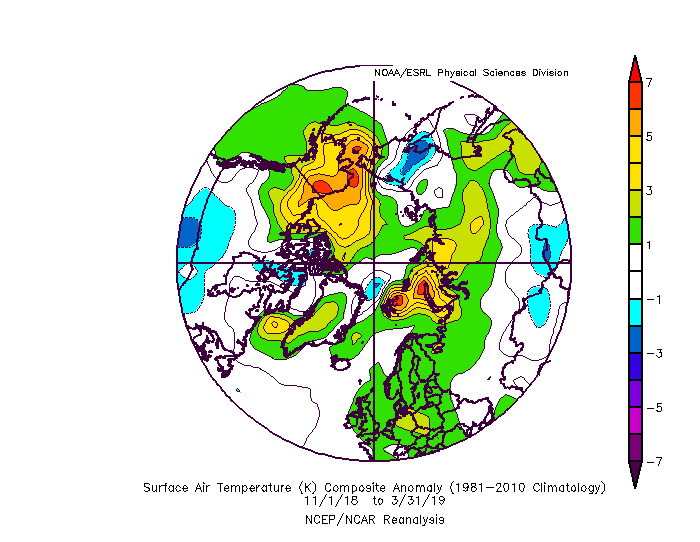
The pattern of surface temperature anomaly was not uniform over the Arctic. The Canadian Basin, Beaufort Sea and Barents Sea regions experienced a very mild winter. By contrast, the East Siberian Sea and much of the rest of the Central Arctic experienced near-normal temperatures on average (Figure 5a). The surface temperature anomalies were associated with a pattern of higher-than-average sea level pressure over the North American continent, and lower-than-average sea level pressure over much of the Arctic Ocean itself, and the north coast of Siberia, with regions of mild temperatures corresponding to those where southerly winds were predominant (Figure 5b).
| a | b |
|---|---|
 |
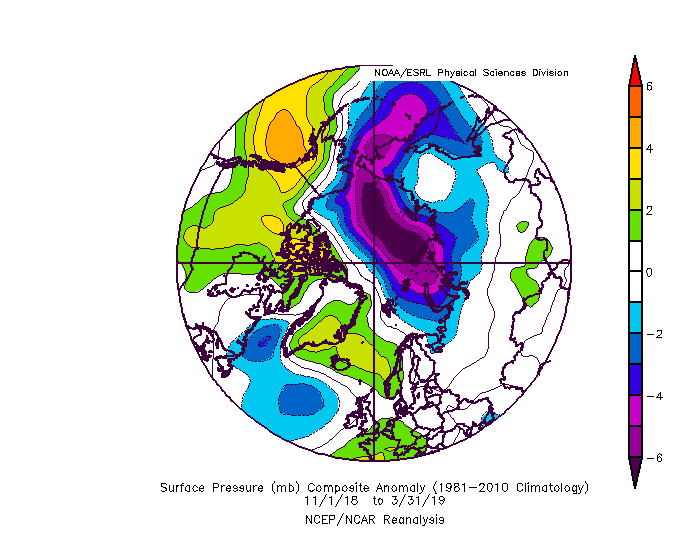 |
Figure 5. Surface meteorological conditions relative to the 1981-2010 average for November 2018 – March 2019: (a) surface air temperature anomaly; (b) mean sea level pressure anomaly. Data are from the NCEP reanalysis.
While sea ice extent during winter 2018-19 did not reach the extreme lows seen in recent winters, it was still well below average. The winter maximum extent of 14.78 million square km was the eighth lowest on record (the lowest being 14.41 million square km in 2017) and was 0.86 million square km below the 1981-2010 average. Notably, extent dropped sharply at the end of March, leading to a period of record low extent lasting until late April. This occurred in association with strong southerly winds in the Bering Sea and Barents Sea regions, and rapid sea ice retreat in these areas.
Measurements of sea ice thickness by CryoSat-2 suggest Arctic sea ice thickness during April 2019 was quite similar to that during April 2018 (Figure 6). Estimates of Arctic sea ice volume are also produced by the forced ice-ocean model PIOMAS (Zhang and Rothrock, 2003). These suggest that, while there was some limited recovery in ice volume during winter 2018-19 (up to March), by the end of May ice volume had fallen to levels below that of the same point in 2018.
The very warm conditions present during May 2019 are likely to be an important factor behind the rapid fall in ice thickness suggested by PIOMAS during this month, as well as the record lows in extent in early June 2019. Notably, from 7th-9th June an abrupt change in Arctic weather conditions took place, with predominantly anticyclonic (settled) conditions giving way to predominantly cyclonic (stormy) conditions. Cyclonic conditions in the Arctic in early summer are associated with reduced sea ice melt (Screen et al, 2011). This is due partly to the associated winds tending to spread the ice cover over a wider area, but may also be due to increased cloud cover preventing sunlight from melting ice directly. Hence the shift in atmospheric conditions is consistent with the observed slowing in melt rate over the past week.
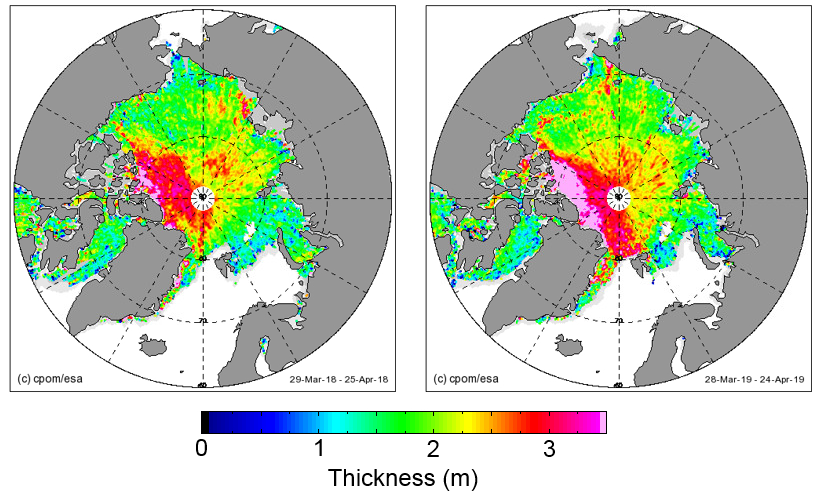
Figure 6. Average Arctic sea ice thickness from (a) 29th March – 25th April 2018; (b) 28th March – 24th April 2019, as estimated from satellite radar altimetry measurement from CryoSat-2. Courtesy of the Centre for Polar Observation and Modelling (Tilling et al., 2016).
Outlook for September
There is no significant correlation between ice extent in mid-June and the seasonal minimum extent in September. As is underlined by the recent abrupt slowing of the Arctic sea ice melt rate, the severity of summer melt is heavily dependent on Arctic weather conditions. Hence it is not possible to predict September sea ice extent with any confidence at this point in the season.
Antarctic sea ice state
Antarctic sea ice extent on 19th June 2019 was 12.55 million square km (Figure 7). This is the lowest extent on record for this date, 1.17 million square km below the 1981-2010 average, the previous lowest being 12.72 million square km in 2017. Extent was exceptionally low in the eastern Weddell Sea, to the west of the Ross Sea, and to the west of the Indian Ocean sector, although there were a few regions where ice extent was slightly above average (Figure 8). Figure 7. Daily Antarctic sea ice extent for 2019, compared with recent years and the 1981-2010 average, with ± 1 and 2 standard deviation intervals indicated by the shaded areas. Data are from NSIDC.
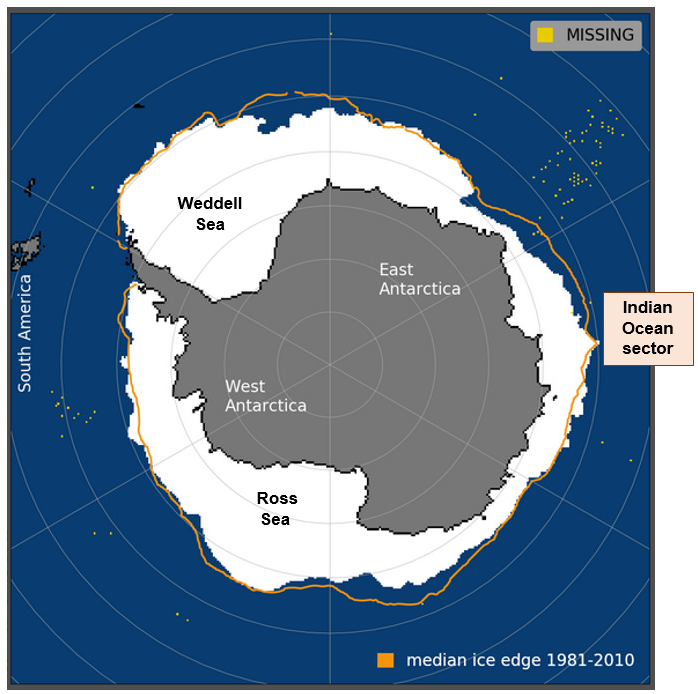
Figure 8. Antarctic sea ice extent on 19th June 2019, with 1981-2010 average extent indicated in orange, and regions referred to in the text labelled. Underlying map and data courtesy of NSIDC.
References
- Rayner, N. A.; Parker, D. E.; Horton, E. B.; Folland, C. K.; Alexander, L. V.; Rowell, D. P.; Kent, E. C. and Kaplan, A.: Global analyses of sea surface temperature, sea ice, and night marine air temperature since the late nineteenth century. J. Geophys. Res. Vol. 108, No. D14, 4407 10.1029/2002JD002670, 2003.
- Screen, J. A., Simmonds, I. and Keay, K: Dramatic interannual changes in perennial Arctic sea ice linked to abnormal summer storm activity. J. Geophys Res., Vol. 116, No. D15, doi: 10.1029/2011JD015847, 2011.
- Stroeve, J. C.; Schroeder, D., Tsamados, M. and Feltham, D.: Warm winter, thin ice? The Cryosphere, 12, 1791-1809, doi: 10.5194/tc-12-1791-2018, 2018.
- Tilling, R. L., Ridout, A., and Shepherd, A.: Near-real-time Arctic sea ice thickness and volume from CryoSat-2, The Cryosphere, 10, 2003-2012, doi:10.5194/tc-10-2003-2016, 2016.
- Zhang, J. and Rothrock, D. A.: Modeling Global Sea Ice with a Thickness and Enthalpy Distribution Model in Generalized Curvilinear Coordinates, Mon. Weather Rev., 131, 5, 845–861, doi: 10.1175/1520-0493(2003)131<0845:MGSIWA>2.0.CO;2, 2003


