

Arctic and Antarctic end-of-season report – October 2022
Alex West and Ed Blockley
Summary
- Arctic sea ice extent for September 2022 was 4.78 million sq km, the joint-10th lowest recorded September extent in the satellite era (since 1979).
- Extent was near-average in the seas bordering the Atlantic Ocean but well below average elsewhere in the Arctic.
- The Arctic summer of 2022 was notably, although not exceptionally, warm. Two very warm periods occurred early and late in the season, both of which corresponded with rapid sea ice loss. However, for the middle of the melting season conditions were cooler with near-average ice loss.
- Predictions of September 2022 sea ice tended to underestimate the eventual extent in June and July, but most predictions in August and September were quite accurate.
- Antarctic sea ice recorded its seasonal maximum of 18.18 million sq km on 16th September; this was the 4th lowest annual maximum extent on record (since 1979).
September Arctic sea ice extent
Average Arctic sea ice extent for September 2022 was 4.78 million sq km according to the HadISST1.2 dataset (Rayner et al., 2003). This was 1.60 million sq km below the 1981-2010 average and 0.60 million sq km above the long-term linear trend (Figure 1). 2022 equalled 2010 as the joint-10th lowest September sea ice extent in the satellite era (since 1979); slightly lower than last September’s extent of 4.87 million sq km, but otherwise the highest September extent since 2014. The trend in September sea ice loss since 1979 is now 81,000 sq km per year.
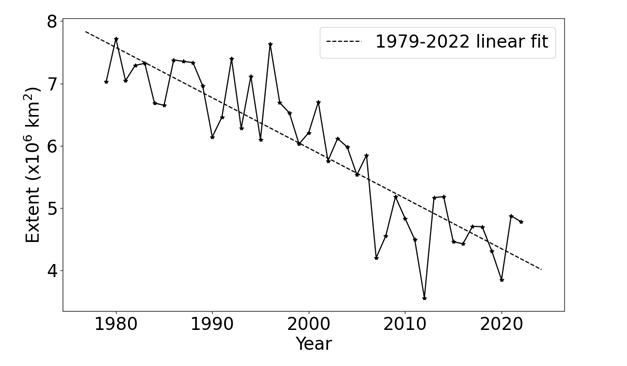
Figure 1. September Arctic sea ice extent during the satellite era, according to HadISST1.2, with linear trend indicated.
September extent was well below average in all regions of the Arctic except in the seas bordering the Atlantic Ocean (Figure 2). In the Beaufort and East Siberian Seas, long ‘arms’ of sea ice extended from the main pack, with a detached region of sea ice in the southern East Siberian Sea surviving until the end of the melt season.
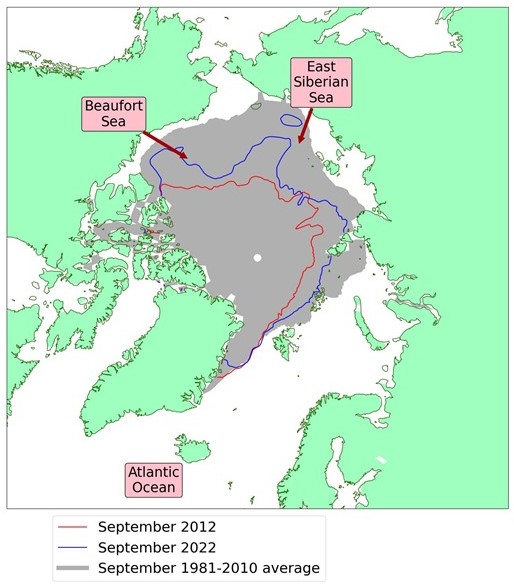
Figure 2. Arctic sea ice extent in September 2022, compared to the record low year of 2012 and the 1981-2010 average, with regions named in the text labelled. Data are from HadISST1.2 (Rayner et al., 2003).
Melt season review
Summer 2022 was notably but not exceptionally warm in the Arctic (Figure 3). As determined from May-August temperature at 925hPa (about 1km high in the atmosphere) across the Arctic Ocean region, temperatures were 1.4°C above the 1981-2010 average, similar to 2021 and considerably cooler than the record warm year of 2020 (3.2°C above average).
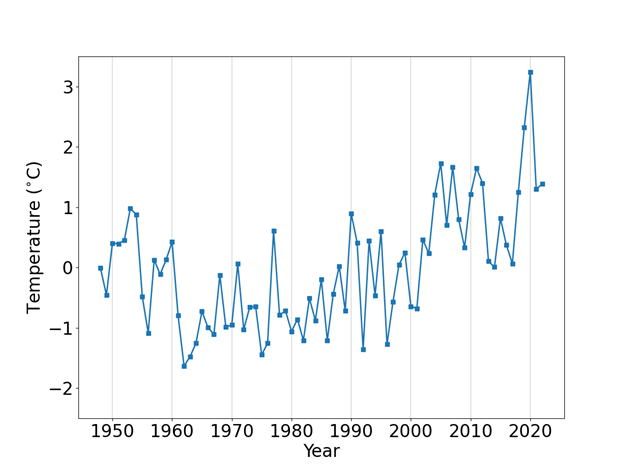
Figure 3. Average May-August temperature anomaly at 925 hPa over the Arctic Ocean region (°C), for the years 1948-2022, relative to the 1981-2010 average. Data are from the NCEP reanalysis (Kalnay et al., 1996).
Weather conditions alternated between stormy and settled, but often weather patterns tended to circulate air within the Arctic, rather than blow very warm air from further south. The main periods of above-average ice loss occurred from late May to mid-June and from mid-August to early September (Figure 4); both occurred in association with persistent pressure ‘dipoles’ that drew in warm air from midlatitudes (Figure 5). From mid-June to mid-August, in between these two warm periods, sea ice loss was near-average, and wind patterns tended to be westerly or easterly, with southerly incursions of warm air occurring only briefly.
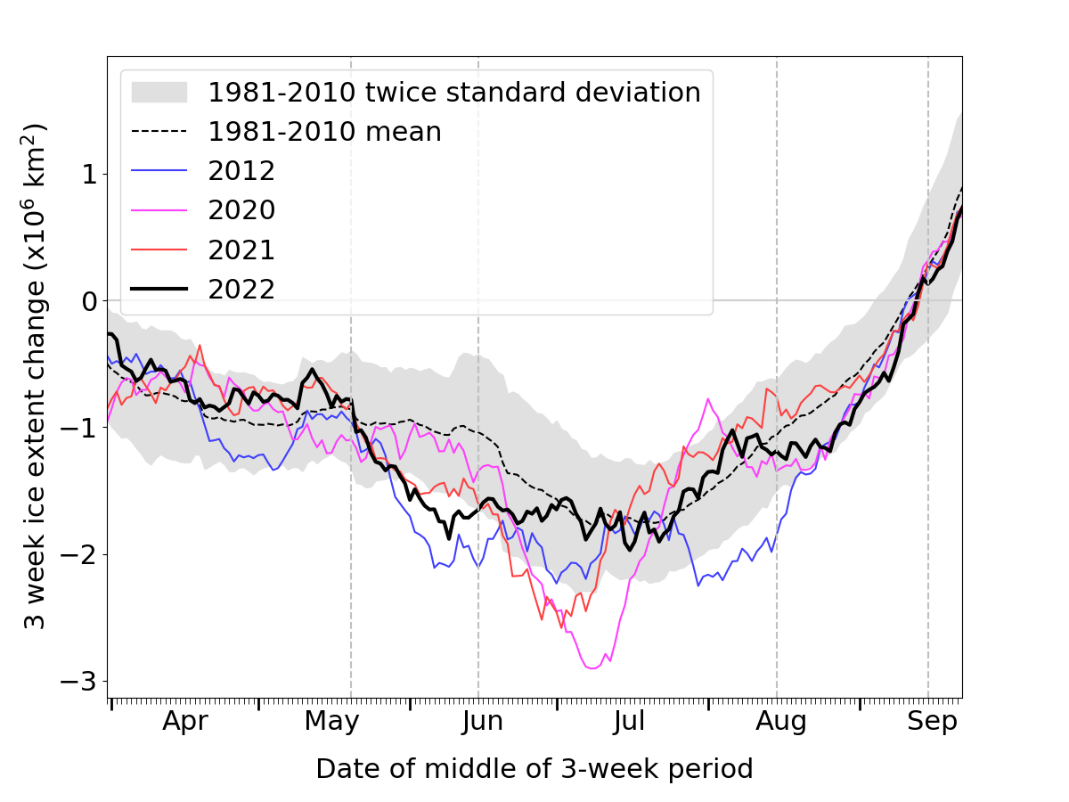
Figure 4. Arctic sea ice melt rate through the melting season illustrated with a 3-week running-mean sea ice extent change for 2022 (black), compared to 2021 (red), 2020 (pink), the record low year of 2012 (blue), and the 1981-2010 average (black dashed line). Data are from NSIDC. Negative values indicate ice melting and positive indicate freezing. The three time periods used in Figure 5 are indicated by grey dashed lines.
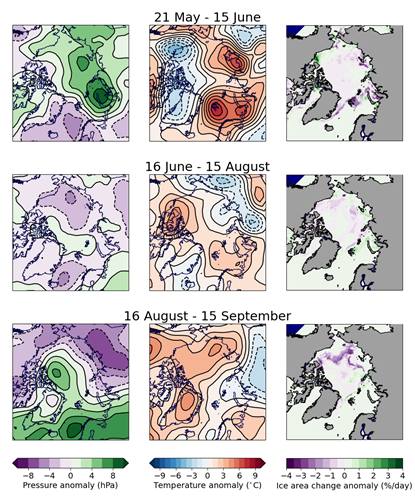
Figure 5. Anomalies of mean sea level pressure (left column), 925hPa temperature (middle column) and ice area rate of change (right column) for three indicated periods of the 2022 melt season. Data are from the NCEP reanalysis for temperature and pressure (Kalnay et al., 1996) and EUMETSAT OSI-SAF (Tonboe et al., 2017) for ice area. Anomalies are relative to the 1981-2010 average. For the ice area, purple indicates areas of faster than average melting while green indicates slower than average.
Assessment of predictions
During the summer, the Sea Ice Prediction Network (SIPN) collates predictions of September Arctic sea ice extent from scientific centres around the world and publishes these predictions in a series of monthly Sea Ice Outlooks (SIO), from June to September. In 2022, sea ice extent fell towards the high end of prediction ranges of the June and July reports, but very close to the median (middle) of the prediction range of the August and September reports (Figure 6).
Met Office statistical predictions of September extent are evaluated in Figure 6 alongside the SIO predictions. These statistical predictions, described in the July and August briefings, were made using correlated anomalies with the most recent 15 days of data (blue line and filled region) and historical melt trajectories (red line and filled region). The eventual September extent lay within the uncertainty intervals of both methods throughout the melt season. However, statistical predictions in mid-August overestimated the September extent. This likely reflects the abrupt switch to above-average melting that occurred in mid-August.
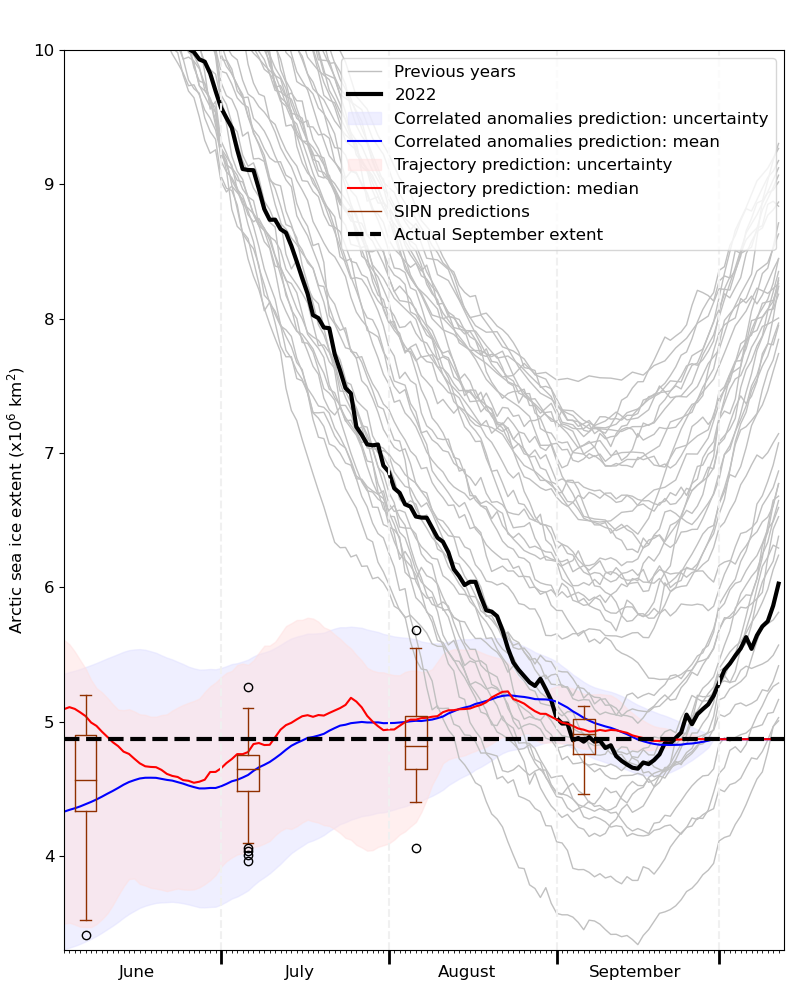
Figure 6. An evaluation of predictions of 2022 September sea ice extent submitted to the Sea Ice Prediction Network (SIPN), alongside statistical predictions performed for the July and August sea ice briefings. Evolution of sea ice extent during the summer in 2022 and previous years is shown for context.
Antarctic sea ice extent
Antarctic sea ice reached a maximum extent of 18.18 million sq km on 16th September 2022; since this date extent has been slowly decreasing (Figure 7). This was the fourth-lowest maximum in the satellite record, after 1986, 2017 and 2002, and was 0.51 million sq km below the 1981-2010 average maximum. Extent at maximum was well below average in the Bellingshausen and Weddell Seas, particularly around the Antarctic peninsula, and was also below average in the Indian Ocean Sector. However, extent was near- or above-average in the Ross Sea (Figure 8).
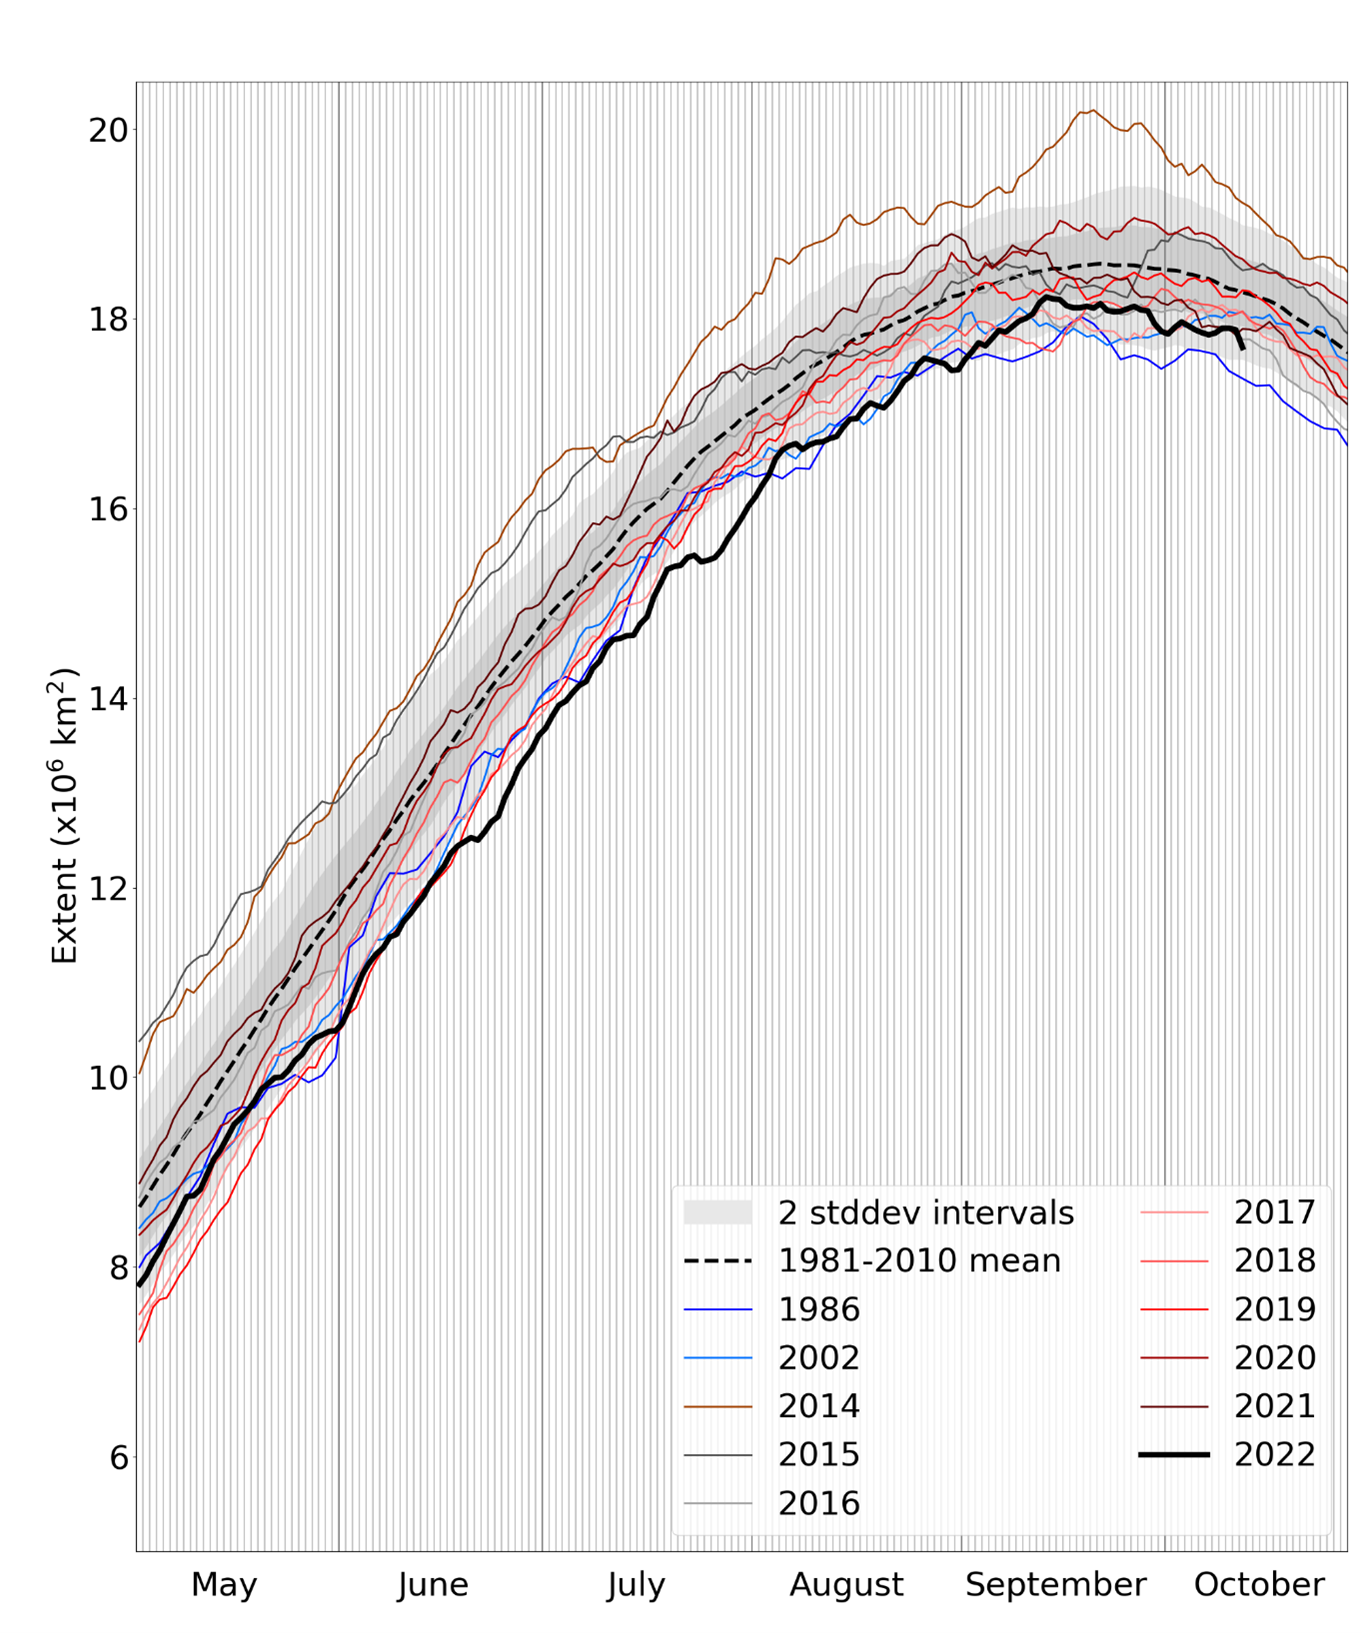
Figure 7. Antarctic sea ice extent for 2022 and other recent years, and the low ice years of 1986 and 2002, compared to the 1981-2010 average, with 1 and 2 standard deviation intervals indicated. Data are from NSIDC.
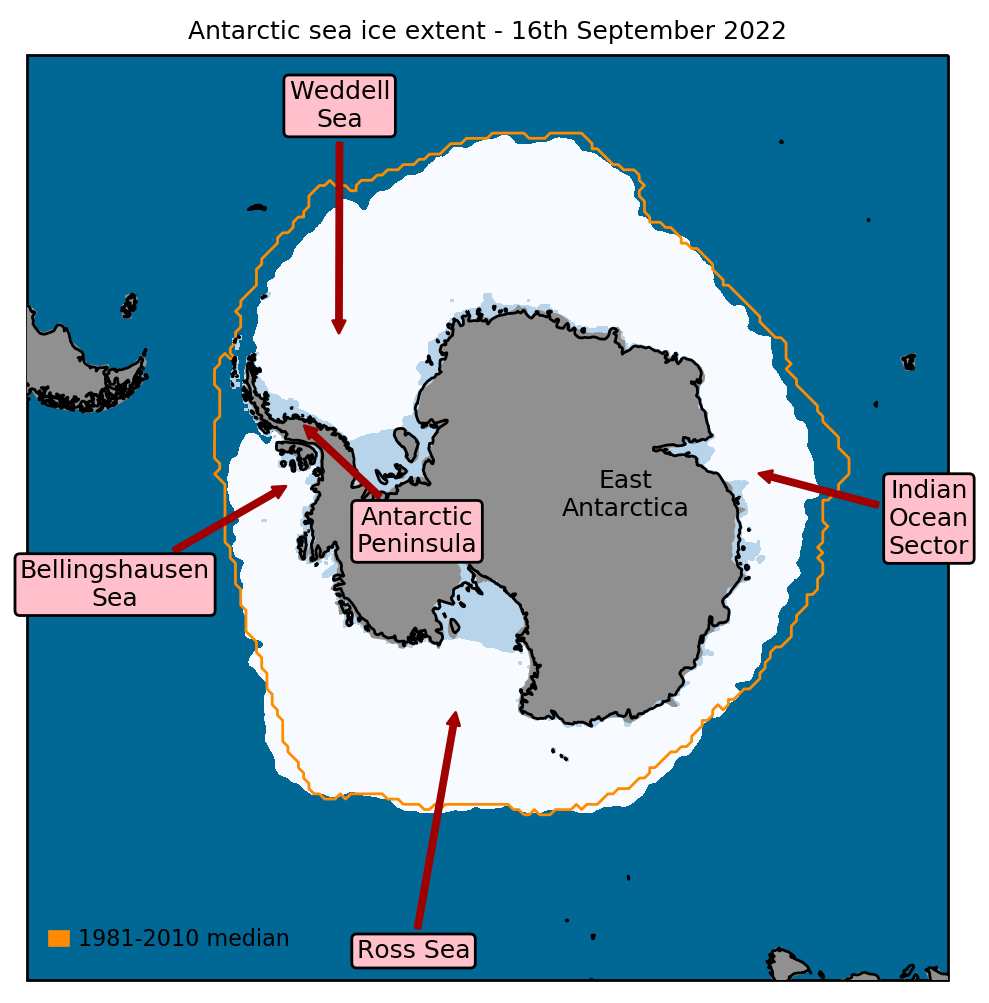
Figure 8. Antarctic sea ice coverage at the winter maximum on 16th September 2022, with 1981-2010 average sea ice extent for this date indicated in orange and regions referred to in the text labelled. Data are from EUMETSAT OSI-SAF (Tonboe et al., 2017).
References
Kalnay, E., and Coauthors (1996) The NCEP/NCAR 40-Year Reanalysis Project. Bull. Amer. Meteor. Soc., 77, 437–472, https://doi.org/10.1175/1520-0477(1996)077<0437:TNYRP>2.0.CO;2
Rayner, N.A., Parker, D.E., Horton, E.B., Folland, C.K., Alexander, L.V., Rowell, D.P., Kent, E.C. and Kaplan, A. (2003) Global analyses of sea surface temperature, sea ice, and night marine air temperature since the late nineteenth century. J. Geophys. Res. Atmos., 108, D14, 4407, https://doi.org/10.1029/2002JD002670
Tonboe, R., Lavelle, J., Pfeiffer, R.-H. and Howe, E. (2017) OSI SAF Global Sea Ice Concentration. Product OSI-401-b. Version 1.6. September 2017, Available at: https://osi-saf.eumetsat.int/products/osi-401-b