Interactive animation of monthly global surface temperatures from 1850 to 2016
Explore our interactive animation of monthly global surface temperatures from 1850 to 2016, and some of the key events that have influenced this 166-year-long record.
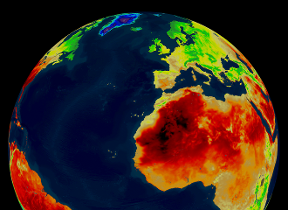
This interactive animation is a collaboration between the Met Office Informatics Lab and the Met Office Hadley Centre. Our scientists, programmers and designers have developed a new way of visualising one of our world-leading global climate datasets, HadCRUT4.
With practical plans now progressing to ensure that global temperatures do not rise beyond 2 °C above pre-industrial levels, we hope that this visualisation tool will engage members of the public, decision-makers and scientists alike.
For the full interactive experience, please open this visualisation using the latest version of Chrome, Firefox or Safari on a desktop. With other devices and browsers you will be able to view the animation without interactive capability while we iron out some compatibility issues.
Watch the video below to find out more.