
UK dry periods and weather patterns
July 2017 - Research published this month, led by the Water Resources Group at Newcastle University and in collaboration with the Met Office, reveals the weather patterns responsible for dry periods over the UK.
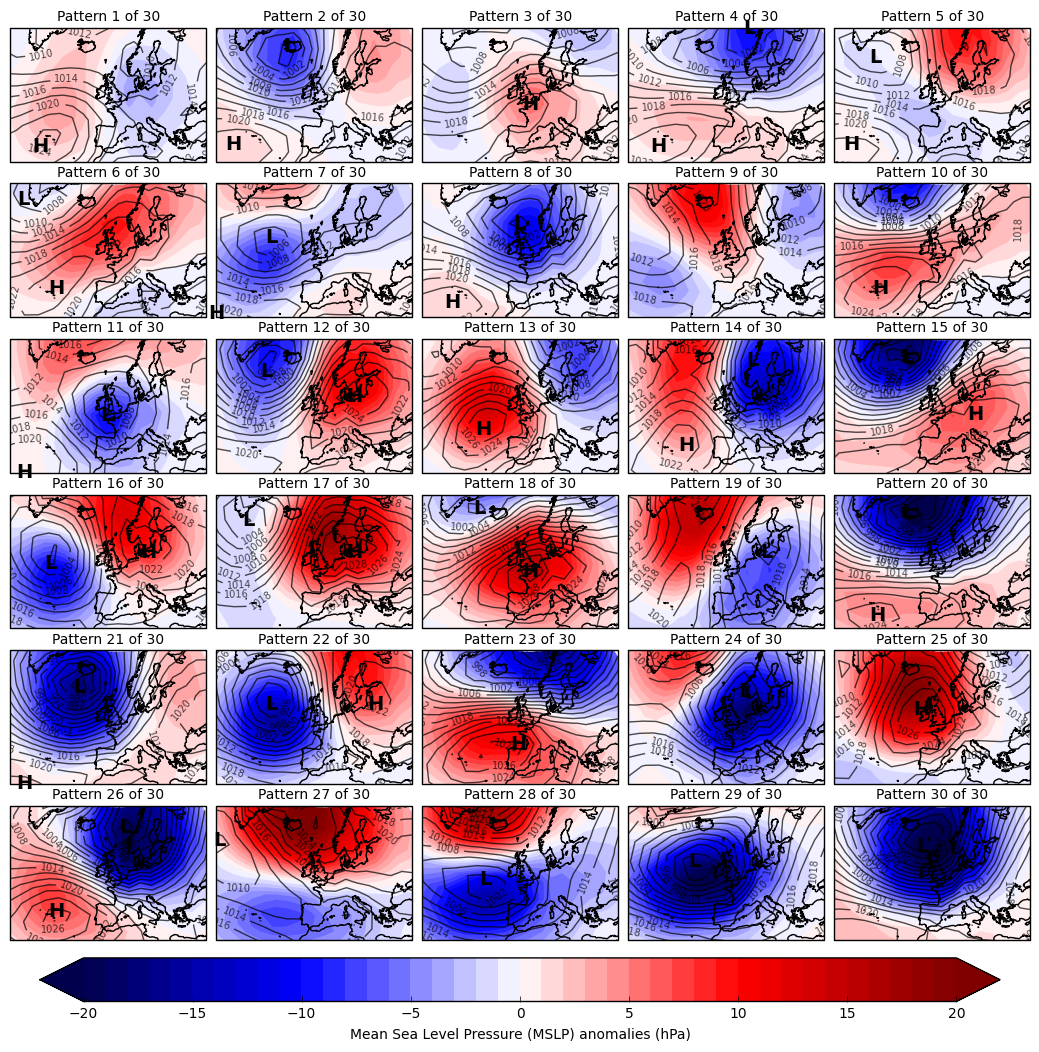
This research, published in the International Journal of Climatology, relates both the Met Office weather patterns (shown below) and Lamb Weather Types to UK regional precipitation observed between 1931 and 2015. The Met Office weather patterns are also related to meteorological drought conditions.
Comparing classifications
Weather patterns are a useful way to characterise the broad-scale atmospheric circulation over a defined region and allow general estimates of local-scale weather. Lamb Weather Types are often used in UK-based analyses, with individual weather patterns based on the eight primary cardinal directions (N, NE, E, SE, S, SW, W, NW) plus cyclonic (C), anticyclonic (A) and unclassified (U) types. In contrast, the Met Office classification was derived by clustering daily mean sea level pressure fields between 1850 and 2003. As a result, there are a higher number of weather patterns featuring a westerly flow over the UK in the Met Office classification compared to Lamb Weather Types.
UK regions
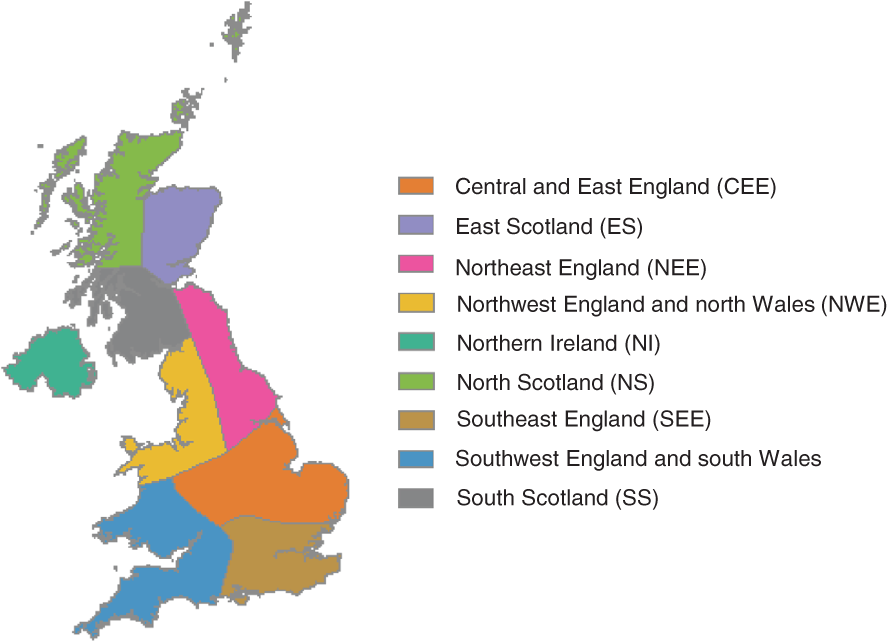
Above: The nine UK regions used in this research.
An analysis of daily precipitation for nine UK regions associated with weather patterns from both classifications reveals that the variability for many of the wet Lamb Weather Types is higher than for the wetter Met Office weather patterns. This is particularly evident for Lamb Weather Types with an easterly flow component (e.g. CNE, CE, and CSE).
Precipitation variability within each Lamb Weather Type
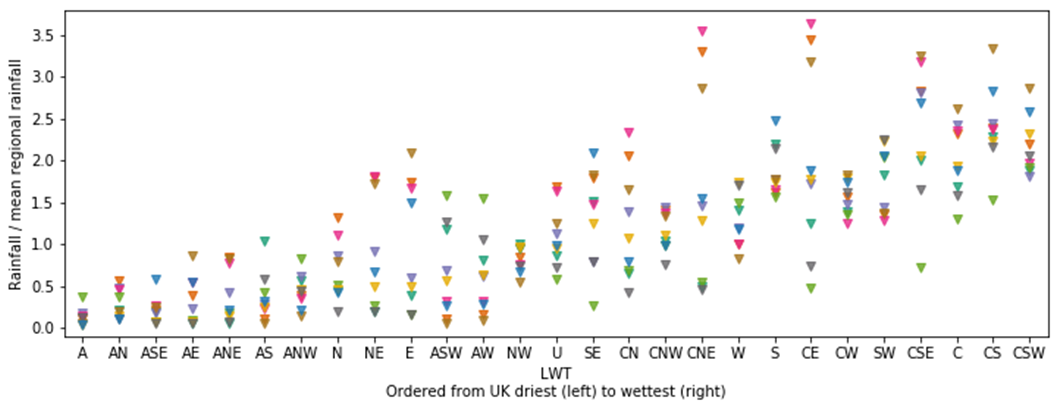
Above: Regional precipitation variability within each Lamb Weather Type, shown as the interquartile range of daily rainfall for all regions and each weather type, expressed as the proportion of precipitation relative to the regional average.
Precipitation variability within each Met Office weather pattern
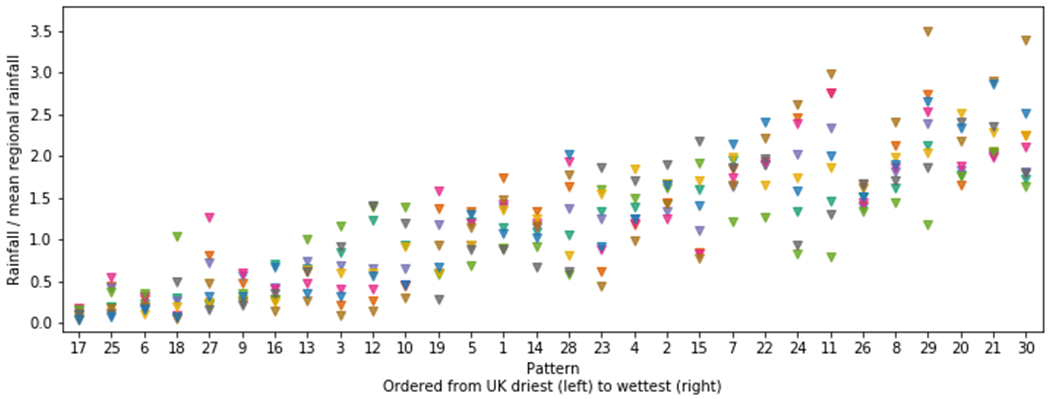
Above: Regional precipitation variability within each Met Office weather pattern, shown as the interquartile range of daily rainfall for all regions and each weather pattern, expressed as the proportion of precipitation relative to the regional average.
The Met Office patterns also have more distinct differences in the daily precipitation distribution than is the case for Lamb Weather Types (as shown by additonal results in the full published paper). These results suggest that the Met Office classification may be more suitable for precipitation analyses in the UK.
Weather patterns associated with drought
By examining the monthly frequencies of the Met Office weather patterns during drought months (defined as the 5% driest months according to a drought index), we can identify which patterns occur more or less often than usual during droughts.
Weather pattern occurrence anomalies during drought periods
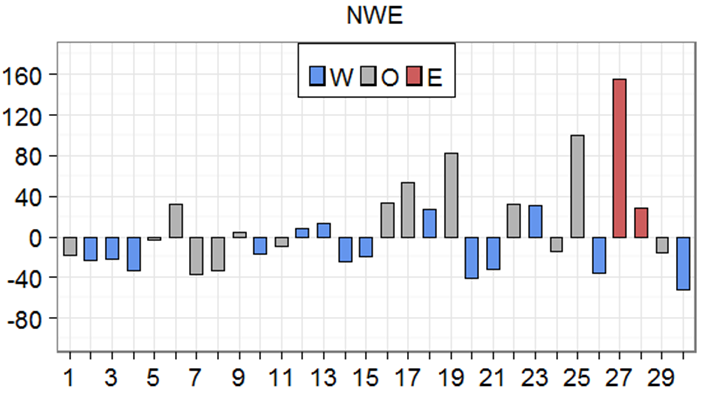
Above: Annual percentage occurrence anomalies for each Met Office weather pattern during drought periods for region NWE. Blue bars = westerly patterns; red bars = easterly patterns; grey bars = all other patterns.
The figure above shows the frequency anomalies of each pattern during three-month droughts in Northwest England and North Wales (labelled NWE). Pattern 27 occurs almost 160% more often during droughts compared to normal. This weather pattern is an anticyclonic easterly with a high over the Norwegian Sea. As such this is a dry pattern for the entire UK but particularly so for western regions. Conversely, Pattern 30 occurs over 40% less often than usual during droughts. Pattern 30 features a deep low centre of pressure southeast of Iceland and is associated with stormy conditions over the UK.
Patterns 27 and 30
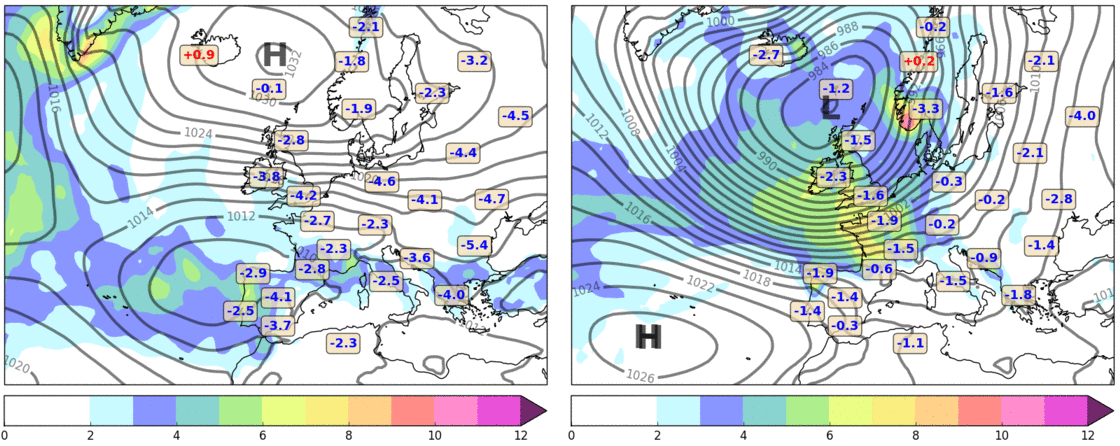
Above: Met Office weather pattern climatology maps for Pattern 27 (left) and 30 (right). Generated using ERA-Interim and a three month period centred on mid-April. Lined contours show mean sea level pressure (hPa); filled contours show daily mean precipitation (mm); boxed values show midday 2m temperature anomalies (degrees C).
Applying these results
Weather patterns and large-scale circulation may be more predictable at long forecasting lead times compared to the actual weather itself. Therefore, knowledge of which weather patterns are high-risk for drought has potential application for producing drought forecasts. A model that can predict weather pattern occurrences months in advance could then be applied to infer future drought conditions over the UK. There are several global seasonal forecast models capable of producing probabilistic forecasts out to this range which would enable a prediction of the spread of weather pattern frequency anomalies, highlighting periods with a higher likelihood of drought conditions.