
Downtime Report for weather delays in construction
A purpose-built report designed to support Extension of Time, Compensation and Relevant Event claims under NEC and JCT contracts.
If the weather negatively affected your project the location-based Downtime Report will provide trusted and accurate information to help with the resolution of contract disputes and compensations.

It’s been developed in cooperation with NEC and JCT to complement adverse weather clauses found in construction contracts such as:
NEC3 and 4 contracts 60.1 (13)
JCT Standard: Clause 2.29.8 or 2.29.9
JCT Design & Build: Clause 2.26.8
JCT Intermediate: Clause 2.20.8
"With solid statistical evidence derived from Met Office observations, both parties can agree on whether a particular month contains a compensation event” - NEC
What is the Downtime Report?
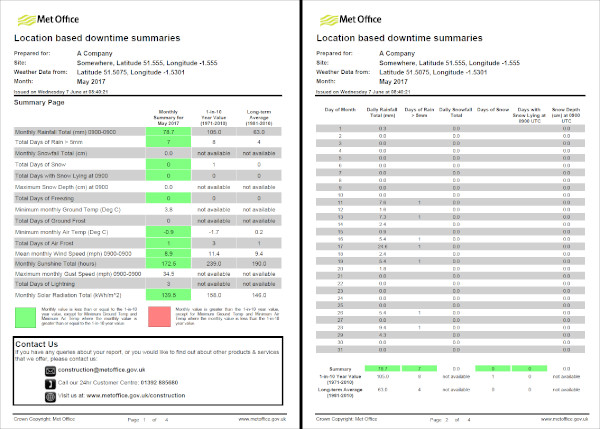
The location-based Downtime Report compares weather parameters from a location point near your project site, with the Long-Term Averages (for JCT contracts) and 1-in-10 year values (for NEC contracts). It helps you easily identify weather conditions that fall outside of normal parameters and may be classified as exceptionally adverse weather. This makes it easy for you to determine whether you can make a claim or not.
You can view the example of the report below:
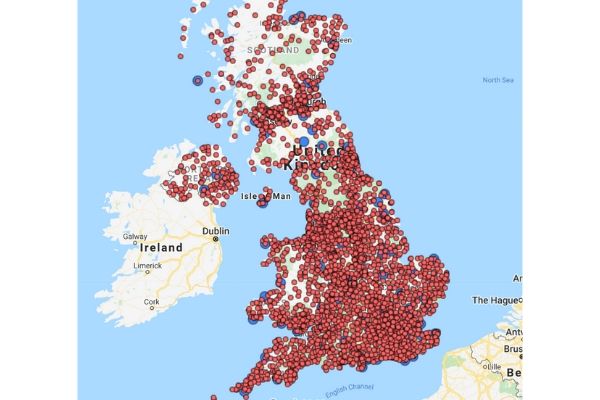
What does ‘location-based’ mean and how can I find my closest location point?
The location-based Downtime Report is available for more than 3500 location in the near vicinity to your project site.
To find your nearest location point (RED dots on the map) click on the map below.
What weather parameters are included in location-based Reports?
The report provides daily data for 16 weather parameters and Long-Term Averages and 1-in-10 values for 11 parameters.
Data on various weather conditions experienced for your months of interest include rainfall, snow, frost, temperatures, sunshine, wind and lightning. 11 of these parameters can then be compared to their corresponding Long-Term Averages and 1-in-10-year values.
For a full list of parameters included, please view the example of the report.
How much does it cost?
The cost of location-based Downtime Report is £183 + VAT. Each report is generated for a calendar month. If, for example, you need data running over 5 months, you’ll need to purchase 5 reports.
How can I purchase this report?
You can buy the location-based Downtime Report through our partner’s JCT website.
If you have any further questions about the Downtime Report, please refer to FAQ’s section below or contact us through the contact form on the right side of this page.
Downtime Report FAQs
What if I need a station-based Downtime Report?
If you’d like to buy the station-based Downtime Report (example), please contact us through the contact form on the right side of this page with the following information:
-
Report name: station-based Downtime Report
-
Name of your company
-
Postcode of your site OR Latitude, Longitude of your site: (to 6 decimal places ensuring Longitude is either +ve or –ve x.xxxxxx,+/- y.yyyyyy)
-
Start Date: (MM/YYYY) and End Date: (MM/YYYY)
-
The type of contract you are operating under (such as NEC, JCT, or PPC Suite)
What is the difference between location and station-based reports?
The newer location-based reports provide conditions for any of 3,650 location points around the UK. Station-based reports are generated for any of 100 weather stations. Both options are acceptable to calculate downtime. However, locations are generally closer to your specific area of interest, so the weather information will more accurately reflect onsite conditions. Location-based reports also include more weather parameters (sixteen) than station-based reports (six).
What is a 1-in-10 figure?
This is the statistical representation of the worst-case scenario you might have had expected every ten years. If the weather at any time exceeds this value, you may have the potential to claim that the weather events were extreme. This is often confused as an average, but it is, in fact, a return period calculated typically using thirty years or more of data.
Do I need to purchase ten years of data to get a 1-in-10 figure?
No. We do the calculations for you saving you both time and money. The 1-in-10 data statistics are included within both the location and station-based reports.
What is the Long-Term Average?
The average conditions observed over the past thirty years. If the weather at any time exceeds this value, for a JCT contract you can claim that the weather events are above average. Whether the weather is sufficiently adverse is for the Contract Administrator or another relevant person under the contract to decide.
What data is available to those who are tendering?
We have a bespoke weather-planning report called the Planning Averages. It’s designed to support project planning and help prepare for weather-related risks. You can view the example of the report here. We also offer bespoke climate solutions for complex projects.
Get in touch
Call us
We are available 24/7.
0370 900 0100Email us
Fill out this short form and we'll get back to you.
Contact Us formFollow us
Linkedin XGet in touch
Call us
We are available 24/7.
0370 900 0100Email us
Fill out this short form and we'll get back to you.
Contact Us form