
London VAAC Quantitative Volcanic Ash charts
Quantitative Volcanic Ash charts (QVA) are produced in accordance with International Civil Aviation Organization (ICAO) Annex 3 requirements and are provided as well as the London Volcanic Ash Advisory Graphics (VAG) and Advisories (VAA). The lowest QVA threshold (0.2 mg/m³) matches to the areas depicted in the VAA and VAG. Both expected ash concentration and probabilistic forecast information is provided in the chart viewer below for eruptions occurring in the London Volcanic Ash Advisory Centre (VAAC) area of responsibility.
More information on QVA forecasts. Information on the QVA API.
Charts will only be available during an eruption or when tests and exercises are carried out.
Information on interpreting the QVA information.
The following chart types are currently available:
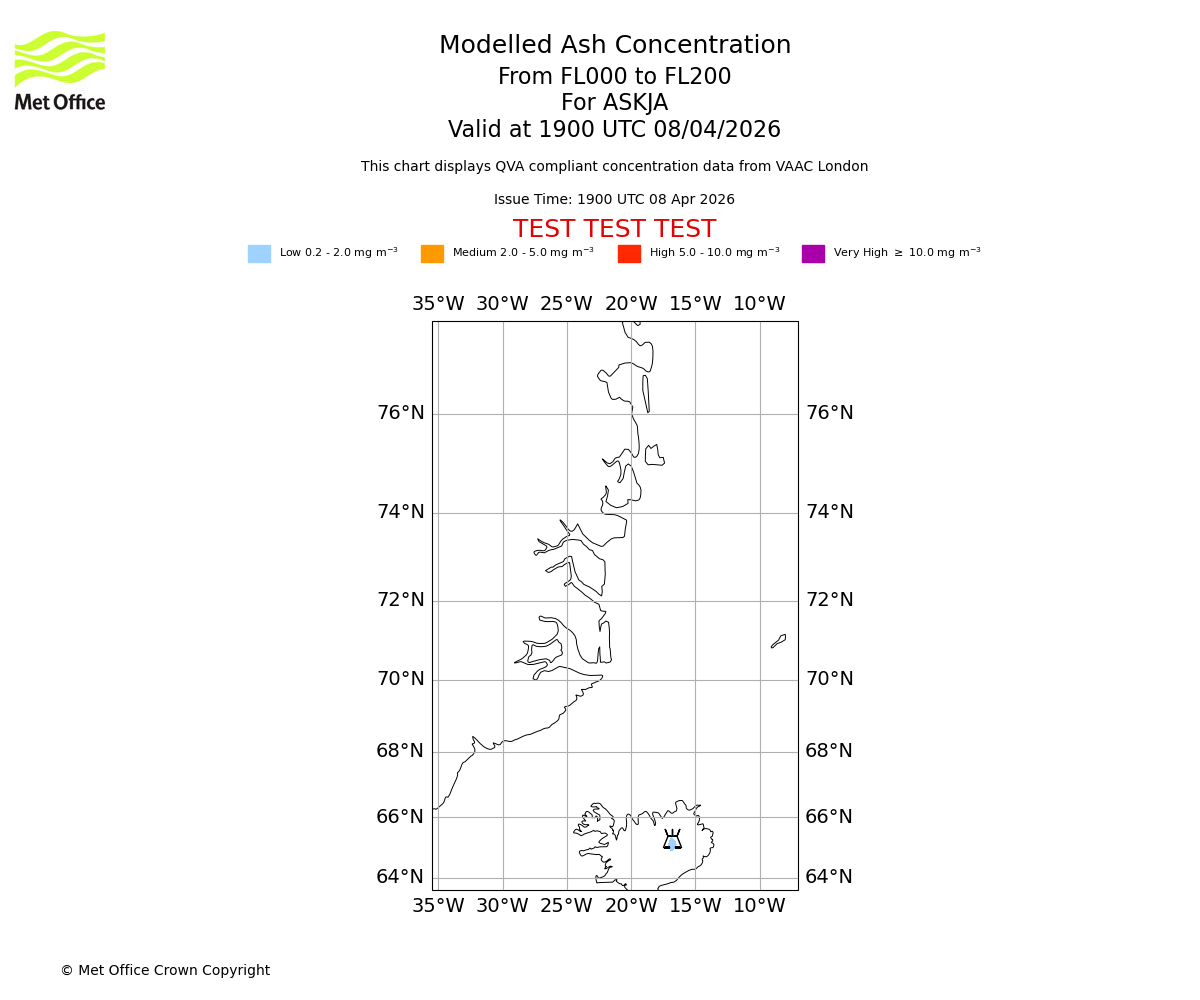
Expected ash concentration
This is the ash concentration expected for 5000ft thick layers of the atmosphere.

Thicker flight level layers
In addition to the ICAO QVA defined products we also provide lower resolution concentration charts for thicker atmospheric layers out to 5 days for additional awareness purposes. These align with the pre-QVA concentration charts.
Note: these charts will be retired in late 2026 or 2027.
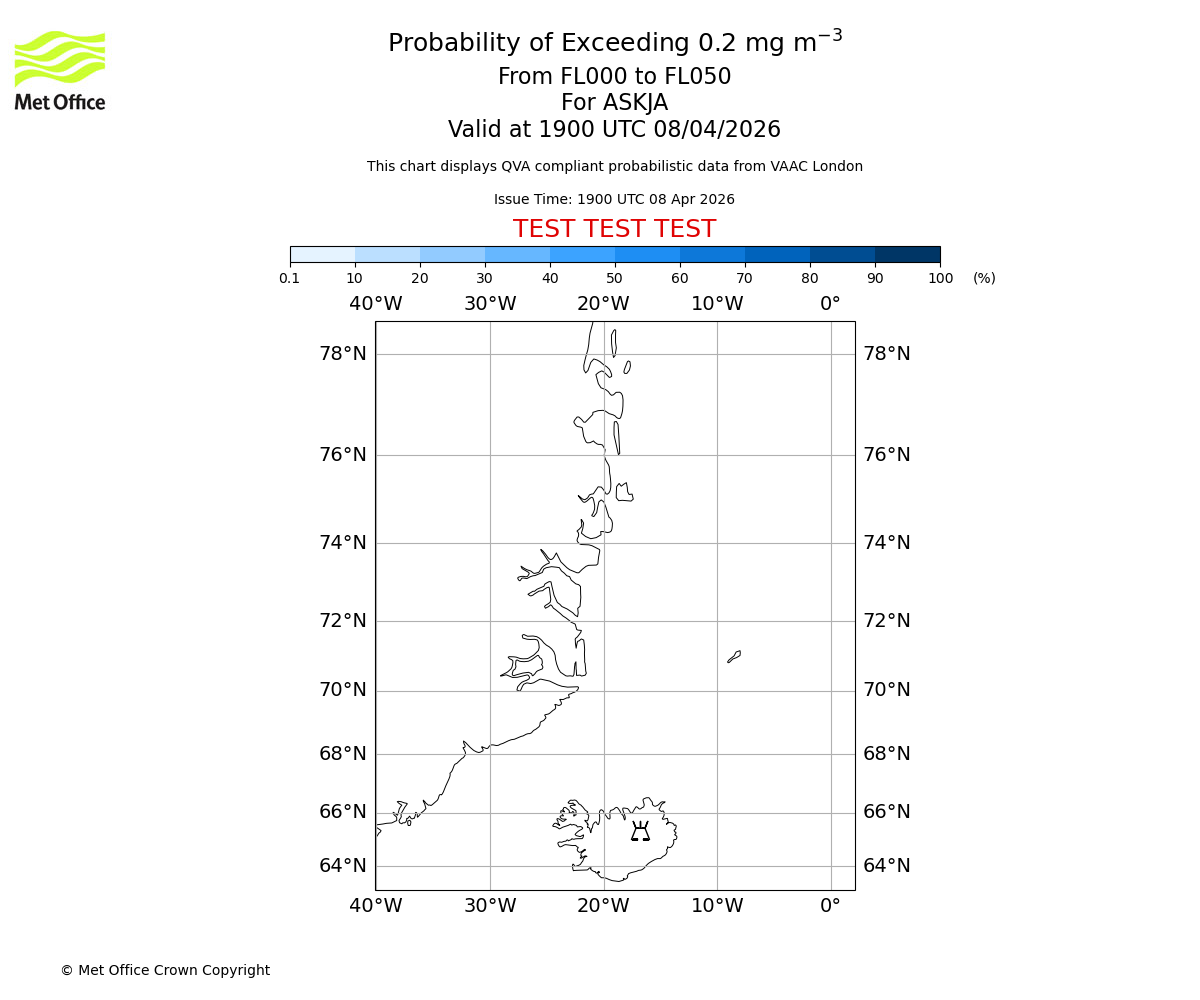
Probabilistic ash concentration
This is the probability of exceeding four different concentration thresholds (0.2, 2.0, 5.0 and 10.0 mg/m³) at 5000 ft thick layers of the atmosphere.
Operators should refer to national NOTAMs for official guidance on any restrictions / actions regarding flight in affected airspace, and the official boundaries applicable to such restrictions/actions. Airlines operating in UK airspace should review the document "Guidance Regarding flight Operations in the Vicinity of Volcanic Ash", issued by the CAA, found on the CAA website.