Confirmation that 2019 concludes warmest decade
Author: Press Office
16:00 (UTC) on Wed 15 Jan 2020
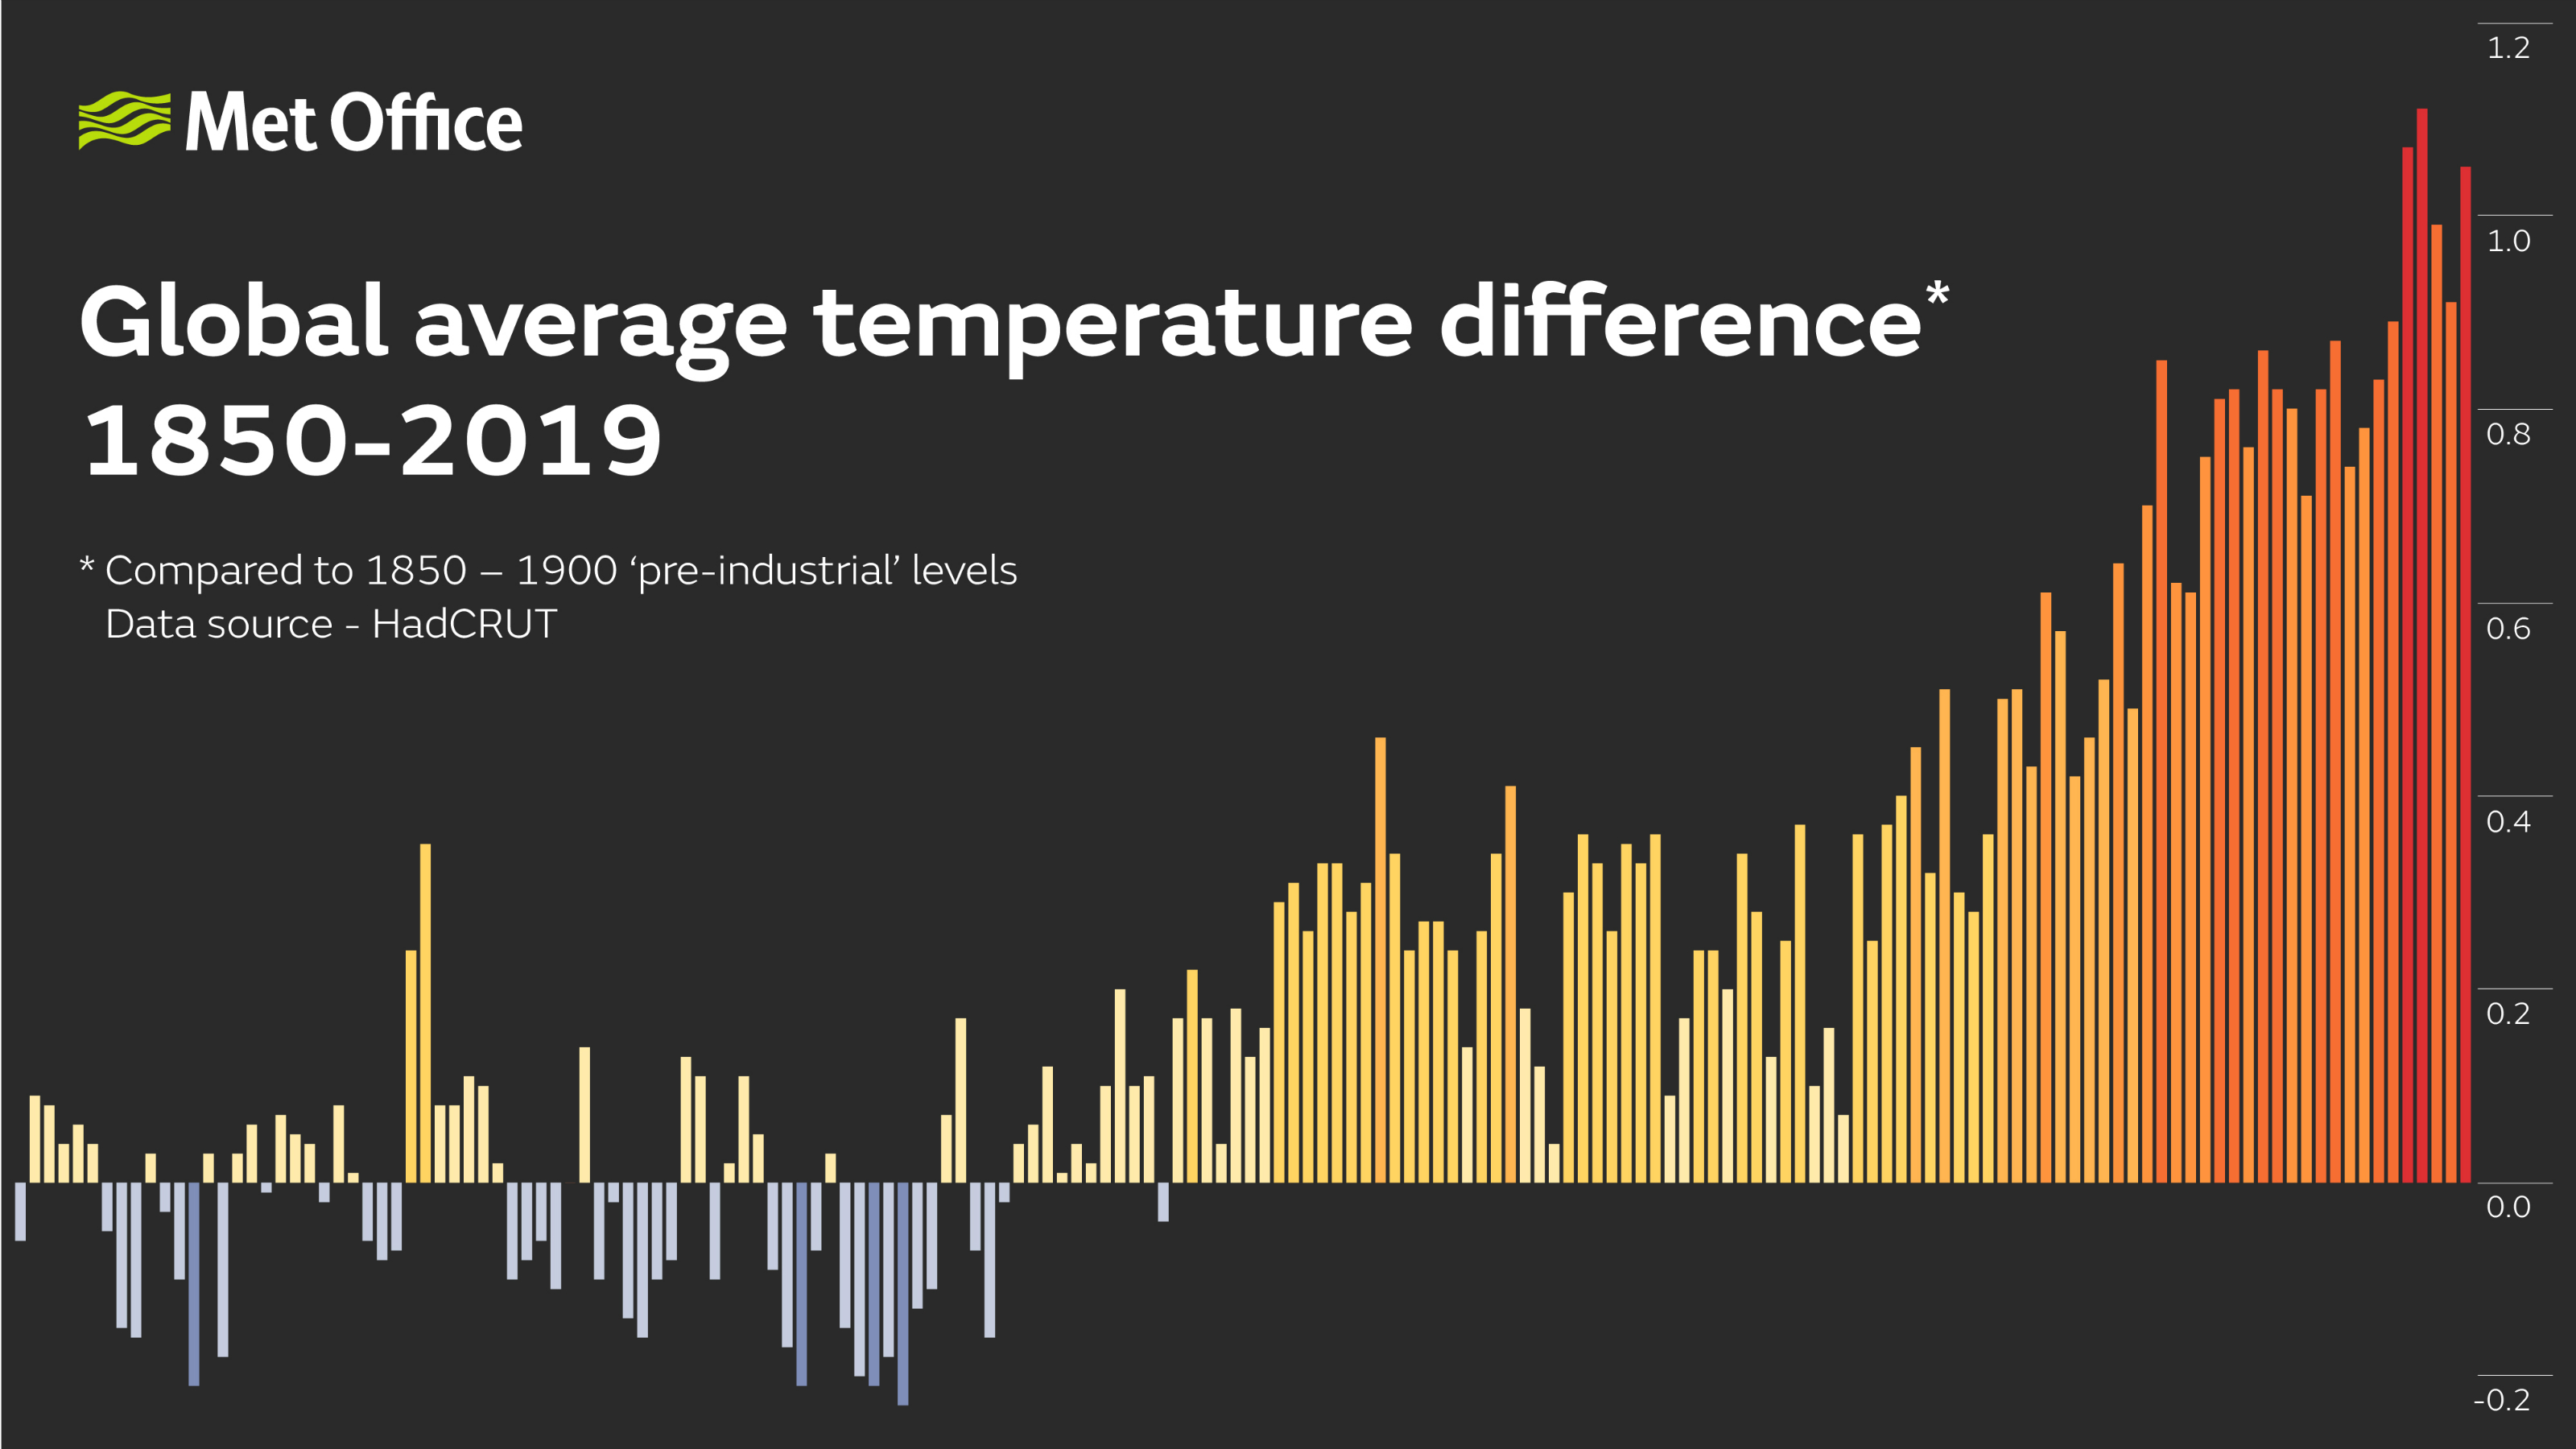
The annual global temperature figures for 2019 confirm that the past decade was the warmest on record.
The data also show that the past five years were the warmest in the 170-year series.
The balance of evidence using multiple data sets suggests that 2019, a year without a strong classical El Niño, is the second warmest year for annual global temperatures in records that begin in 1850. Only 2016 has been warmer, a year when temperature was boosted by a significant El Niño.
Scientists at the Met Office Hadley Centre, the University of East Anglia's Climatic Research Unit and the UK National Centre for Atmospheric Science produce the HadCRUT4 dataset, which is used to estimate global temperature.
The HadCRUT4 global temperature series shows that the average for 2019 as a whole was 1.05±0.1 °C above pre-industrial levels, taken as the average over the period 1850-1900. 2019 is nominally the third warmest year in the HadCRUT4 series.
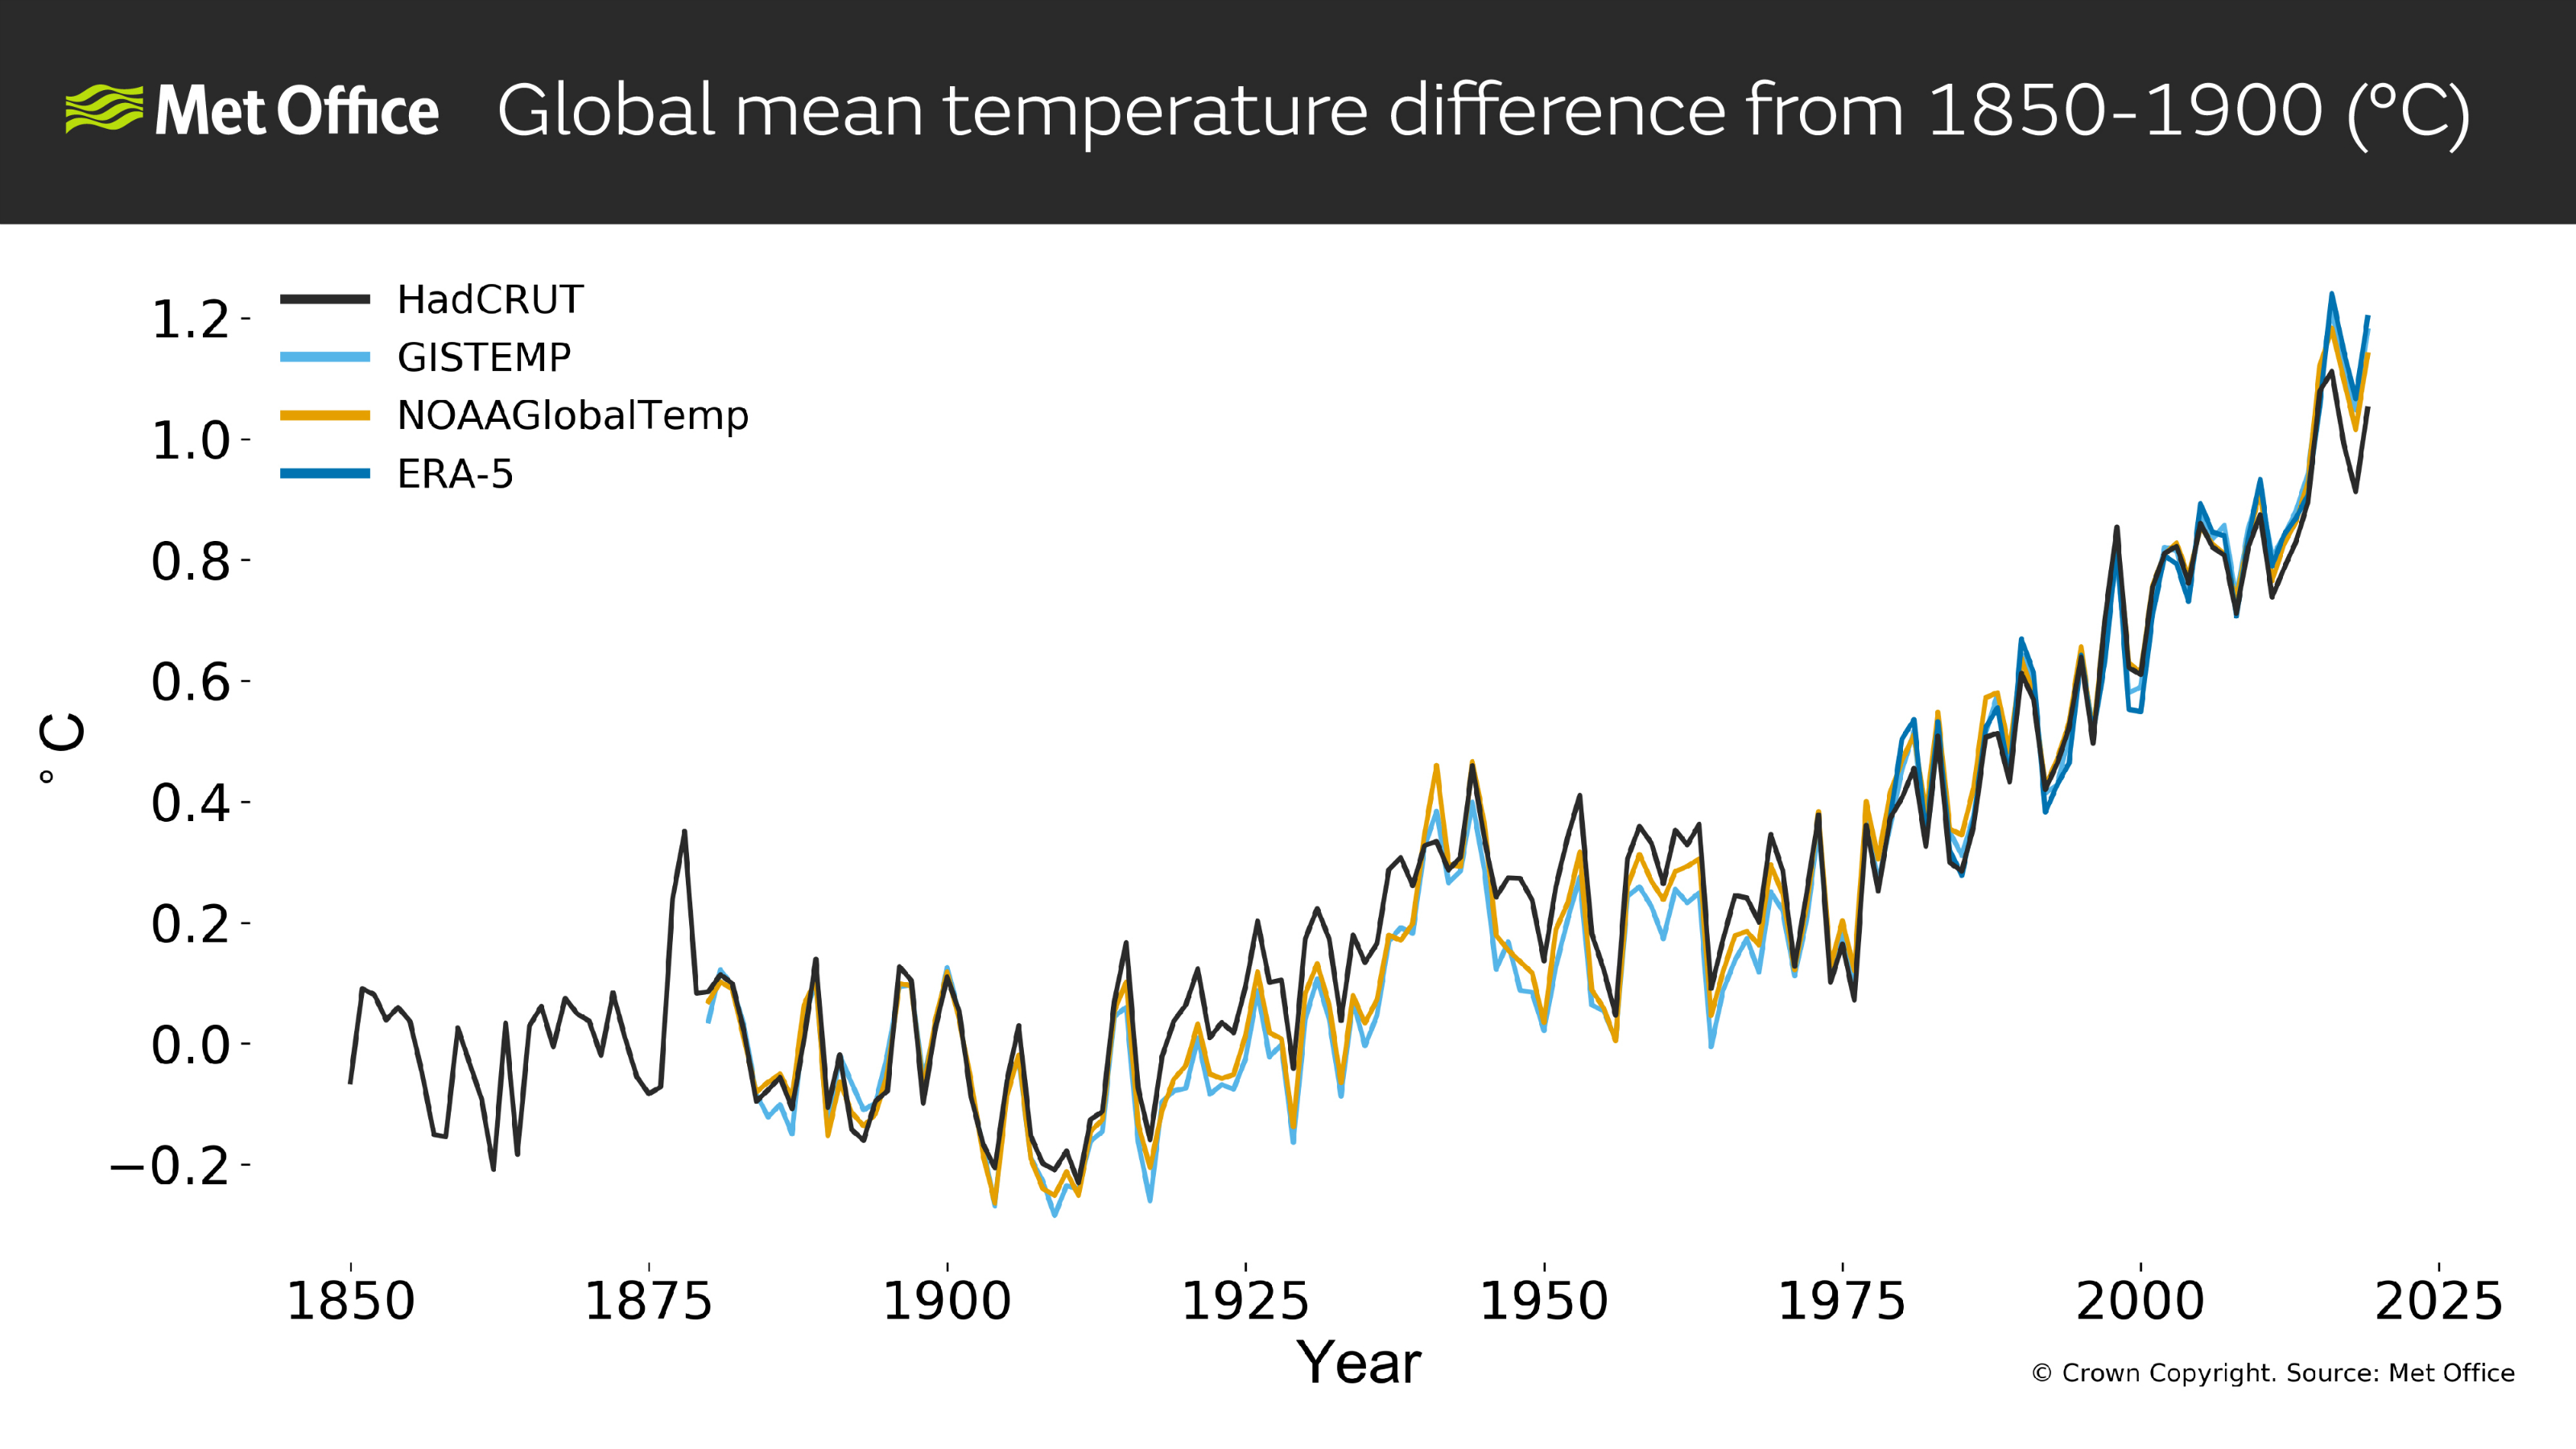
NASA and NOAA have also published their global mean temperature estimates for 2019. All three datasets (NASA, NOAA and HadCRUT4) agree that the last five years were the warmest five years since each global record began. NASA and NOAA have positioned 2019 as the second warmest year in their records.
Differences between the various estimates arise largely from the way that the data-sparse polar regions are handled. Taking the evidence from the three records, together with other estimates from reanalyses, suggests that 2019 was most likely the second warmest year.

Dr Colin Morice of the Met Office Hadley Centre said: “Our collective global temperature figures agree that 2019 joins the other years from 2015 as the five warmest years on record.
“Each decade from the 1980s has been successively warmer than all the decades that came before. 2019 concludes the warmest ‘cardinal’ decade (those spanning years ending 0-9) in records that stretch back to the mid-19th century.”
Dr Morice concluded: “While we expect global mean temperatures to continue to rise in general, we don’t expect to see year-on-year increases because of the influence of natural variability in the climate system.”
On a more regional level, this confirmation follows close on the heels of the recent Met Office announcement that the 2010s have been the second warmest of the cardinal decades over the last 100 years of UK weather records.
The Bureau of Meteorology in Australia has also recently confirmed that 2019 was the warmest and driest year on record in Australia. 2019 was also one of the warmest years on record for Europe, including a record-breaking summer heatwave.
The HadCRUT4 global temperature dataset is compiled from many millions of air and sea surface temperature measurements taken across the globe, from all continents and all oceans. The regional variations in temperature are themselves informative in understanding the mechanisms that cause warming in response to the continuing build-up of greenhouse gases in the atmosphere.
Prof Tim Osborn, Director of Research at the University of East Anglia’s Climatic Research Unit, said: "While we know that human activities are causing the globe to warm, it is important to measure this warming as accurately as possible. We are confident that the world has warmed by about 1.0 °C since the late nineteenth century because different methods of working out the global temperature give very similar results."
The Met Office recently released its forecast for global average temperature for 2020. This forecasts the global average temperature for 2020 to be between 0.99 °C and 1.23 °C - with a central estimate of 1.11 °C - above the pre-industrial average period from 1850–1900, and likely extending the recent run of hottest years unless an unpredictable event such as a large volcanic eruption occurs.
The main contributor to warming over the last 170 years is human influence on climate from increasing greenhouse gases in the atmosphere. The effects of human-induced climate change are not limited to surface temperature. Warming of the climate system is seen across a range of climate indicators that build a holistic picture of change outside of our expectations from natural variability across the land, atmosphere, oceans and ice.

| Year | HadCRUT °C |
|---|---|
| 2019 | 1.05 |
| 2018 | 0.91 |
| 2017 | 0.99 |
| 2016 | 1.11 |
| 2015 | 1.08 |
| 2014 | 0.89 |
| 2013 | 0.83 |
| 2012 | 0.79 |
| 2011 | 0.74 |
| 2010 | 0.87 |


